EngageNY
Read Expressions in Which Letters Stand for Numbers
Pencil in the resource on writing verbal phrases into your lesson plans. The 15th installment of a 36-part module has scholars write verbal phases for algebraic expressions. They complete a set of problems to solidify this skill.
EngageNY
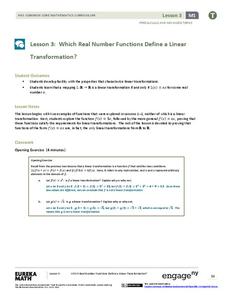
Which Real Number Functions Define a Linear Transformation?
Not all linear functions are linear transformations, only those that go through the origin. The third lesson in the 32-part unit proves that linear transformations are of the form f(x) = ax. The lesson plan takes another look at examples...
EngageNY
An Exercise in Creating a Scale Drawing
Design your dream classroom. The lesson plan contains an exercise to have teams create a scale drawing of their dream classroom. Pairs take the measurements of their classroom and furniture and create a scale factor for them. To finish...
EngageNY
Addition and Subtraction Formulas 1
Show budding mathematicans how to find the sine of pi over 12. The third instructional activity in a series of 16 introduces the addition and subtraction formulas for trigonometric functions. Class members derive the formulas using...
EngageNY
Linear and Nonlinear Expressions in x
Linear or not linear — that is the question. The lesson plan has class members translate descriptions into algebraic expressions. They take the written expressions and determine whether they are linear or nonlinear based upon the...
EngageNY
The Graph of a Linear Equation—Horizontal and Vertical Lines
Graph linear equations in standard form with one coefficient equal to zero. The lesson plan reviews graphing lines in standard form and moves to having y-coefficient zero. Pupils determine the orientation of the line and, through a...
Illustrative Mathematics
Which Weighs More? Which Weighs Less?
Expand the the comparative language of young mathematicians with a hand-on weight measurement activity. Working independently or in pairs, children compare the weight of large wooden blocks to various other classroom objects, recording...
EngageNY
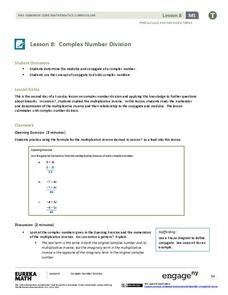
Complex Number Division 2
Individuals learn to divide and conquer complex numbers with a little help from moduli and conjugates. In the second lesson on complex number division, the class takes a closer look at the numerator and denominator of the multiplicative...
EngageNY
Modeling with Inverse Trigonometric Functions 1
Where should I stand to get the best view? Pupils use inverse trigonometric functions to determine the horizontal distance from an object to get the best view. They round out the lesson by interpreting their answers within context.
EngageNY
Constant Rates Revisited
Find the faster rate. The resource tasks the class to compare proportional relationships represented in different ways. Pupils find the slope of the proportional relationships to determine the constant rates. They then analyze the...
EngageNY
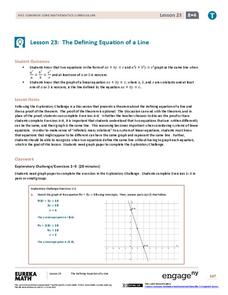
The Defining Equation of a Line
They appear to be different, yet they are the same line. Part 24 out of 33 lessons provides a theorem about the relationships of coefficients of equivalent linear equations. Pupils use the theorem to determine whether two equations are...
EngageNY
Percent of a Quantity
Visualize methods of finding percents. Classmates find a percent of a quantity using two methods including a visual model in the 26th lesson in a series of 29. By the end of the lesson, scholars find percents given a part and the whole...
EngageNY
An Appearance of Complex Numbers 2
Help the class visualize operations with complex numbers with a lesson that formally introduces complex numbers and reviews the visualization of complex numbers on the complex plane. The fifth installment of a 32-part series reviews...
Illustrative Mathematics
Buying Bananas, Assessment Version
Practice with unit rates, proportions, and ratios when Carlos purchases an amount of bananas. Learners must interpret a graph to decide whether points on the same line represent similar proportional relationships. Use with lesson plans...
EngageNY
The Line Joining Two Distinct Points of the Graph y=mx+b Has Slope m
Investigate the relationship between the slope-intercept form and the slope of the graph. The lesson plan leads an investigation of the slope-intercept equation of a line and its slope. Pupils realize the slope is the same as the...
EngageNY
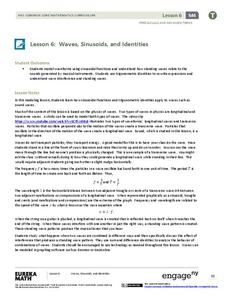
Waves, Sinusoids, and Identities
What is the net effect when two waves interfere with each other? The lesson plan answers this question by helping the class visualize waves through graphing. Pupils graph individual waves and determine the effect of the interference...
Illustrative Mathematics
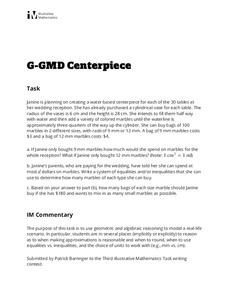
Centerpiece
Learners hear wedding bells in this problem set, as they help a fictional bride plan the centerpieces for her wedding reception. Algebra is married to geometry as volume, aesthetics, and budgeting all come into play. Learners are...
EngageNY
Scaling Principle for Volumes
Review the principles of scaling areas and draws a comparison to scaling volumes with a third dimensional measurement. The exercises continue with what happens to the volume if the dimensions are not multiplied by the same...
Charleston School District
Pre-Test Unit 6: Systems
As if solving equations with an x isn't tricky enough, now they add a y, too? A pre-assessment gauges the knowledge of your classes related to systems. They are asked to solve graphically and algebraically and to solve word...
Curated OER
More and Less Handfuls
Working as a pair, two kindergartners will sit at a table and will pick two handfuls of counters. They will combine their individual handfuls into one, and count their own selection. They will then draw and record their count on a record...
Illustrative Mathematics
Double Plus One
Practice doubling with a straightforward worksheet. Learners double plus one each number in the table, and then answer a series of hypothetical math equations.
Illustrative Mathematics
Counting by Tens
With this daily counting activity, your kindergartners will master counting in sequence automatically from 0 to 100, and will count in multiples of ten to 100. With the whole class, count to 100. With each number, learners will whisper...
EngageNY
Comparing Estimated Probabilities to Probabilities Predicted by a Model
Small groups devise a plan to find the bag that contains the larger percentage of blue chips. they then institute their plans and compare results to the actual quantities in the bags.
EngageNY
General Prisms and Cylinders and Their Cross-Sections
So a cylinder does not have to look like a can? By expanding upon the precise definition of a rectangular prism, the lesson develops the definition of a general cylinder. Scholars continue on to develop a graphical organizer...
Other popular searches
- Autism Lesson Plans Math
- Math Lesson Plans
- Baseball Lesson Plans Math
- Dinosaurs Lesson Plans Math
- Math Measurement Lesson Plans
- Math Puzzles Lesson Plans
- Math Lesson Plan Adaptation
- Halloween Math Lesson Plans
- Maths Money Lesson Plans
- Elementary Math Lesson Plans
- Christmas Math Lesson Plans
- Math Money Lesson Plans

