Curated OER
More graphing situations by making a table
Students make a table and graph plotting points. In this algebra lesson, students graph linear equations on a coordinate plane. They calculate the rate of change and analyze the graph for extrapolation.
Earth Day Network
Healthy Earth, Sick Earth
Earth is sick and needs our help! Read the children's book Planet Earth Gets Well to explain the various problems facing the planet, discussing what young conservationists can do to heal the planet along the way. A great Earth...
Curated OER
Y-Intercept and Slope Intercept Form
Alegebra amateurs identify the slope and the y-intercept given a linear equation in slope-intercept form by correctly completing some in class problems. They write the linear equation in slope-intercept form that corresponds to the given...
Cornell University
Atomic Bonding
Explore the connection of surface area to bonding within atoms. Learners complete lab investigations to model changing surface area with different sizes and concentrations of atoms. A flour fireball demonstration follows the labs to...
Science Friday
Capturing Carbon Dioxide
Why don't we just capture carbon dioxide in the air and store it somewhere else? A hands-on instructional activity allows scholars to explore a complex concept. First, they will create a carbonated beverage, and then they...
Teach Engineering
Building a Barometer
Forget your local meteorologist — build your own barometer and keep track of the weather with an activity that provides directions to build a barometer out of a narrow necked bottle, a glass, and some water. Using their barometer,...
Breaking News English
More People to Stick to New Year's Resolutions
What makes a good New Year's resolution? Practice goal-setting and reading comprehension with a set of language arts activities. English learners work on cloze passages, synonym matches, interviewing exercises, and...
Chicago Botanic Garden
Plant Phenology Data Analysis
Scientists monitor seasonal changes in plants to better understand their responses to climate change, in turn allowing them to make predictions regarding the future. The last activity in the series of six has scholars analyze BudBurst...
Attainment Company
Money Skills
Young mathematicians learn to make sense out of money with this collection of skills practice worksheets. From identifying the different coins and bills in the US currency system, to counting money and correctly using the dollar and...
EngageNY
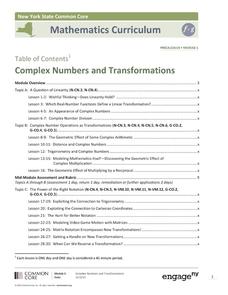
Complex Numbers and Transformations
Your learners combine their knowledge of real and imaginary numbers and matrices in an activity containing thirty lessons, two assessments (mid-module and end module), and their corresponding rubrics. Centered on complex numbers and...
Mathematics Vision Project
Module 4: Rational Functions
Time to study the most sensible function — rational functions! The seven-lesson unit develops the concept of a rational function through a connection to rational numbers and fractions. Scholars graph functions, solve equations, and...
Indian Land Tenure Foundation
A Sense of Belonging
In order to understand how the land changes over time because of the people who live there, learners interview an elderly person about the past. Children ask an older family member to describe what the local area was like when they were...
iCivics
Students, Engage!
Discuss as a class some problems that you would like to see changed in your school or community, and then take action! After your young citizens determine the appropriate steps they should take to accomplish their objectives, they will...
Curated OER
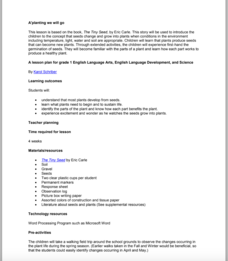
A'planting We will Go
Germination is an amazing process that results in amazing things. The book The Tiny Seed is the inspiration for a set of activities that will help build early literacy, observation, language, and writing skills. The class observes how...
Mathematics Vision Project
Module 6: Trigonometric Functions
Create trigonometric functions from circles. The first lesson of the module begins by finding coordinates along a circular path created by a Ferris Wheel. As the lessons progress, pupils graph trigonometric functions and relate them to...
Chicago Botanic Garden
Seed Dispersal and Plant Migration
There are five methods of seed dispersal. They include gravity, mechanical, animal, water, and air. Scholars study seed dispersal in lesson five of the series of six. Through discussions, hands-on analysis of different seed types, and...
Willow Tree
Line Graphs
Some data just doesn't follow a straight path. Learners use line graphs to represent data that changes over time. They use the graphs to analyze the data and make conclusions.
EngageNY
Comparing Linear Functions and Graphs
How can you compare linear functions? The seventh installment of a 12-part module teaches learners how to compare linear functions whose representations are given in different ways. They use real-world functions and interpret features in...
Curated OER
Connect the Spheres: Earth Systems Interactions
Is everything really connected? Take your class on a walk outside, where they will make observations and write them down on a worksheet. Once they are back in the classroom, learners will work to determine if and how things like birds,...
Serendip
Evolution of Fur Color in Mice – Mutation, Environment and Natural Selection
Most species of animals include a variety of fur or hair color, but why? Scholars watch a video about a changing environment for mice. As the rocks around them change hues, different colors of mice begin to thrive. Discussion questions...
National Save
Dating Violence: Are You a Victim?
The teenagers in your class are probably involved in romantic relationships, but are they keeping themselves safe? Guide learners through the warning signs for dating violence with a series of lessons and discussions.
Public Schools of North Carolina
Math Stars: A Problem-Solving Newsletter Grade 2
Develop the problem solving skills of your young learners with this collection of math newsletters. Covering a variety of topics ranging from simple arithmetic and number sense to symmetry and graphing, these...
Center for Learning in Action
Gases
Explore the properties of gases through one activity and two investigations in which super scientists observe the changes gas makes when encountering different conditions.
Willow Tree
Bar Graphs
Circles, lines, dots, boxes: graphs come in all shapes in sizes. Scholars learn how to make a bar graph using univariate data. They also analyze data using those bar graphs.


