Curated OER
Word Problem Practice Workbook
Need worksheets that challenge your middle schoolers to apply their understanding of math? Problem solved! From integers, fractions, and percents, to algebra, geometry, and probability, over 100 pages of word problem worksheets...
Coloring Squared
Baseball Play Basic Division
Use a baseball themed color by number worksheet that focuses on basic division to reinforce those math skills. After solving each problem, young mathematicians color each square according to the key and the corresponding answer.
Illustrative Mathematics
Comparing Growth, Variation 2
A twist on the first variation of the growth task, this task poses an argument on two explanations of which snake grew more, based on the idea that two is a larger part of six rather than 10.
KOG Ranger Program
Campfire Safety
Make sure that campfire is completely out before packing up your campsite! A straightforward and informational worksheet encourages learners to match pictures to the sequential steps needed to safely extinguish a campfire, and to note...
Willow Tree
Bar Graphs
Circles, lines, dots, boxes: graphs come in all shapes in sizes. Scholars learn how to make a bar graph using univariate data. They also analyze data using those bar graphs.
Rational Number Project
Initial Fraction Ideas: Lesson 3
Visual models support young mathematicians as they deepen their fractional number sense in this elementary math activity. Using fraction circle manipulatives, children explore basic unit fractions as they develop the...
Willow Tree
Line Plots
You can't see patterns in a jumble of numbers ... so organize them! Learners take a set of data and use a line plot to organize the numbers. From the line plot, they find minimum, maximum, mean, and make other conclusions about the...
Curriculum Corner
Fraction Brochures
Make fractions fun and interesting by using a brochure form. Young mathematicians practice and gain a better understanding of how to add and subtract fractions, simplify fractions, and find LCD (least common denominator). The resources...
Royal BC Museum
Kids Page - Whales
Read about the physical features of whales and how they are grouped according to their method of eating food. A neat activity is described on the page; consider carrying this out in class. The resource makes a nice addition to a lesson...
EngageNY
Percent of a Quantity
Visualize methods of finding percents. Classmates find a percent of a quantity using two methods including a visual model in the 26th lesson in a series of 29. By the end of the lesson, scholars find percents given a part and the whole...
Virginia Department of Education
Going the Distance
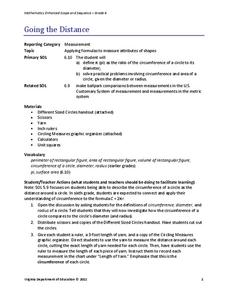
Estimate the value of one of the most famous irrational numbers. The hands-on lesson instructs classmates to measure the circumference and diameters of circles using yarn. The ratio of these quantities defines pi.
Curated OER
Line of Best Fit
In this line of best fit worksheet, students solve and complete 8 different problems that include plotting and creating their own lines of best fit on a graph. First, they study the samples at the top and plot the ordered pairs given on...
K12 Reader
Adapting to Survive
Life science and language arts come together in a passage about animal adaptation. After kids learn about how organisms adapt to conditions in their environments, they complete five reading comprehension questions based on context clues...
Math Drills
Christmas Word Problems
Solve 10 festive word problems during the holiday season! Santa and his team need your class's help to decorate, sort toys, organize reindeer, and bake toffee with multiplication and division skills.
Mathed Up!
Scatter Graphs
Make an estimate by getting in line. The class works with scatter plots and lines of best fit to make an estimate for given values. Pupils determine whether there is a positive or negative correlation and draw a best-fit line. Using the...
Have Fun Teaching
Short Vowels
Early readers use words with short vowels to complete sentences, referencing a word bank. They choose four and five letter words from a word bank like wish, sun, and fast to complete 10 simple sentences.
Super Teacher Worksheets
Accept and Except
Accept and except: although these two words sound similar, their meanings are very different. With a 10-question worksheet, grammar enthusiasts prove their understanding of the two commonly confused words by reading...
Curated OER
Figurative Language - Figuring it Out
Play this slide show and then find out how much your class has learned with the included quiz. After jotting down the definitions of each term, class members label 10 examples with one of five terms: simile, metaphor, personification,...
EngageNY
Analyzing Residuals (Part 2)
Learn about patterns in residual plots with an informative math lesson. Two examples make connections between the appearance of a residual plot and whether a linear model is the best model apparent. The problem set and exit ticket...
EngageNY
Chance Experiments with Outcomes That Are Not Equally Likely
The fifth portion of the 25-part series introduces probabilities calculated from outcomes that are not equally likely. Class members use tables to calculate probabilities of events, add outcome's probabilities, and find...
Math Worksheets Land
Pie or Circle Graphs - Guided Lesson
A guided lesson worksheet reinforces pie graph skills using a given set of data. Each problem requires young mathematicians to create a circle graph using five colors, and to provide a key that goes along with the graph.
Achieve
Spread of Disease
Viruses can spread like wildfire, and mathematics can model the speed of infection. Given a function, scholars analyze it to describe the spread of a disease within a stadium. Learners find the initial number infected and the maximum...
Mathematics Assessment Project
Table Tiling
How many total tiles does it take to tile a table top? Learners apply geometric concepts to determine the number of tiles needed for a specific square table top, and then use the result to create expressions for the number of tiles...
Balanced Assessment
Produce Stand
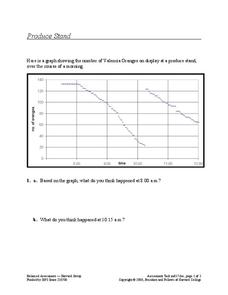
Interpret a graph of the number of oranges at a produce stand to determine a likely event at different times. They also analyze the graph to determine which time period oranges were selling most quickly.


