Inside Mathematics
Sorting Functions
Graph A goes with equation C, but table B. The short assessment task requires class members to match graphs with their corresponding tables, equations, and verbalized rules. Pupils then provide explanations on the process they used to...
Curated OER
Adding and Subtracting Polynomials
For use with a TI-nspire calculator, this lesson focuses on adding and subtracting polynomials. Learners use calculator to add and subtract polynomials using both the vertical method horizontal methods. A class discussion follows the...
EngageNY
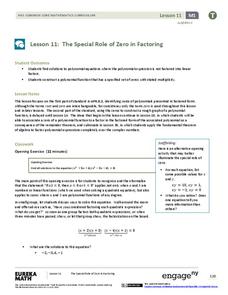
The Special Role of Zero in Factoring
Use everything you know about quadratic equations to solve polynomial equations! Learners apply the Zero Product Property to factor and solve polynomial equations. They make a direct connection to methods they have used with quadratic...
EngageNY
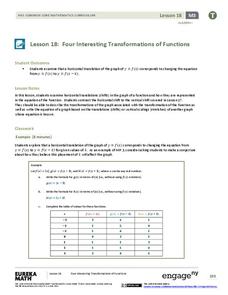
Four Interesting Transformations of Functions (Part 2)
What happens to a function whose graph is translated horizontally? Groups find out as they investigate the effects of addition and subtraction within a function. This nineteenth lesson in a 26-part series focuses on horizontal...
EngageNY
Rearranging Formulas
Model for your learners that if they can solve an equation, they can rearrange a formula with a well-planned activity that has plenty of built-in practice. As the activity progresses the content gets progressively more...
EngageNY
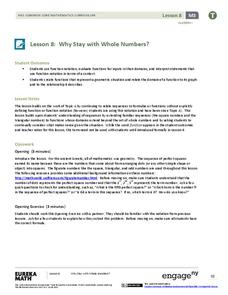
Why Stay with Whole Numbers?
Domain can be a tricky topic, especially when you relate it to context, but here is a lesson that provides concrete examples of discrete situations and those that are continuous. It also addresses where the input values should begin and...
Curated OER
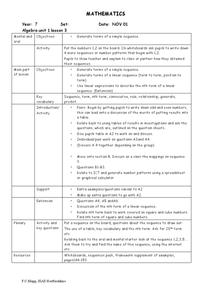
Sequences and Linear Equations
Students identify the formula to find the nth term. In this algebra lesson, students finish a pattern and identify missing parts in a sequence. They write an equation given a partial sequence.
EngageNY
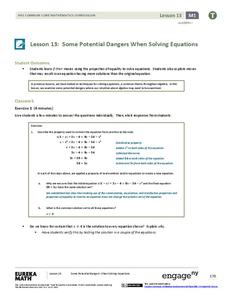
Some Potential Dangers When Solving Equations
Need a less abstract approach to introducing extraneous solutions? This is it! Young mathematicians explore properties used to solve equations and determine which operations maintain the same solutions. They...
EngageNY
Distributions—Center, Shape, and Spread
Data starts to tell a story when it takes shape. Learners describe skewed and symmetric data. They then use the graphs to estimate mean and standard deviation.
EngageNY
Solving Quadratic Equations by Completing the Square
Many learners find completing the square the preferred approach to solving quadratic equations. Class members combine their skills of using square roots to solve quadratics and completing the square. The resource incorporates a...
EngageNY
Representing, Naming, and Evaluating Functions (Part 2)
Notation in mathematics can be intimidating. Use this lesson to expose pupils to the various ways of representing a function and the accompanying notation. The material also addresses the importance of including a domain if necessary....
Inside Mathematics
Graphs (2004)
Show your pupils that perimeter is linear and area is quadratic in nature with a short assessment task that requests learners to connect the graph and equation to a description about perimeter or area. Scholars then provide a...
Curated OER
Simple Sequence
Students identify the nth term in a sequence. In this algebra instructional activity, students generate sequences given the formula for each sequence. They find the formula given the sequence.
EngageNY
Estimating Centers and Interpreting the Mean as a Balance Point
How do you balance a set of data? Using a ruler and some coins, learners determine whether the balance point is always in the middle. Through class and small group discussions, they find that the mean is the the best estimate of the...
EngageNY
Graphs of Piecewise Linear Functions
Everybody loves video day! Grab your class's attention with this well-designed and engaging resource about graphing. The video introduces a scenario that will be graphed with a piecewise function, then makes a connection to domain...
EngageNY
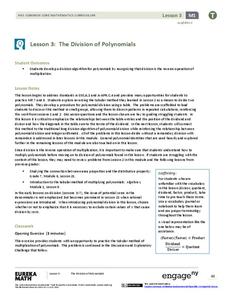
The Division of Polynomials
Build a true understanding of division of polynomials. Learners use their knowledge of multiplying polynomials to create an algorithm to divide polynomials. The area model of multiplication becomes the reverse tabular method of division.
EngageNY
Why Call It Tangent?
Discover the relationship between tangent lines and the tangent function. Class members develop the idea of the tangent function using the unit circle. They create tables of values and explore the domain, range, and end behavior of...
EngageNY
Graphing the Tangent Function
Help learners discover the unique characteristics of the tangent function. Working in teams, pupils create tables of values for different intervals of the tangent function. Through teamwork, they discover the periodicity, frequency, and...
EngageNY
What Is a Trigonometric Identity?
Protect yourself from identity theft! Establishing a strong understanding of the Pythagorean identity allows learners to prove that sine^2x + cos^2x = 1. They then use the identity to find sine or cosine ratios given the other.
EngageNY
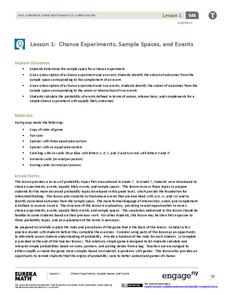
Chance Experiments, Sample Spaces, and Events
Want a leg up on the competition? Show classes how to use mathematics to their advantage when playing games. Learners calculate probabilities to determine a reasonable scoring strategy for a game.
EngageNY
Sampling Variability in the Sample Proportion (part 1)
Increase your sample and increase your accuracy! Scholars complete an activity that compares sample size to variability in results. Learners realize that the greater the sample size, the smaller the range in the distribution of sample...
EngageNY
Sampling Variability in the Sample Proportion (part 2)
Increase your sample and increase your accuracy! Scholars complete an activity that compares sample size to variability in results. Learners realize that the greater the sample size, the smaller the range in the distribution of sample...
EngageNY
Sampling Variability in the Sample Mean (part 2)
Reduce variability for more accurate statistics. Through simulation, learners examine sample data and calculate a sample mean. They understand that increasing the number of samples creates results that are more representative of the...
EngageNY
Differences Due to Random Assignment Alone
It takes a lot of planning to achieve a random result! Learners compare results of random assignment, and conclude that random assignment allows results to be attributed to chance. They also realize the set of random means...


