Statistics Education Web
NFL Quarterback Salaries
Use statistics to decide if NFL quarterbacks earn their salaries! Learners study correlation coefficients after using technology to calculate regression equations. Through the data, they learn the meaning of correlation and correlation...
Texas State Energy Conservation Office
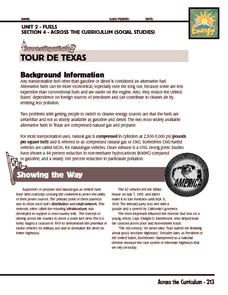
Investigation: Tour de Texas
Teams of Texas tourists gather into groups to analyze what they can do with $50 worth of an alternative fuel. They write checks, keep a balance sheet, and map out their sight-seeing route taking into consideration the location of...
Curated OER
Math Cross--Puzzle #8
In this pounds and ounces worksheet, students complete a math crossword puzzle as they solve twenty-eight math problems involving pounds and ounces intertwined with addition, subtraction and multiplication problems.
West Contra Costa Unified School District
Correlation and Line of Best Fit
Computers are useful for more than just surfing the Internet. Pupils first investigate scatter plots and estimate correlation coefficients. Next, they use Microsoft Excel to create scatter plots and determine correlation...
Teach Engineering
What's Wrong with the Coordinates at the North Pole?
Here is an activity that merges technology with life skills as individuals use Google Earth to explore the differences between coordinate systems and map projections. The self-guided worksheet is the fourth segment in a nine-part unit....
EngageNY
Interpreting Correlation
Is 0.56 stronger than -0.78? Interpret the correlation coefficient as the strength and direction of a linear relationship between two variables. An algebra instructional activity introduces the correlation coefficient by estimating...
EngageNY
Revisiting the Graphs of the Trigonometric Functions
Use the graphs of the trigonometric functions to set the stage to inverse functions. The lesson reviews the graphs of the basic trigonometric functions and their transformations. Pupils use their knowledge of graphing functions to model...
Teach Engineering
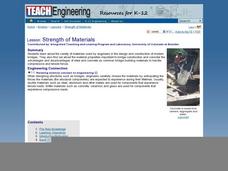
Strength of Materials
Pupils examine a stress-strain diagram that compares the advantages and disadvantages of the two common bridge building materials, concrete and steel. The also consider the factors that influence the materials builders choose for their...
Teach Engineering
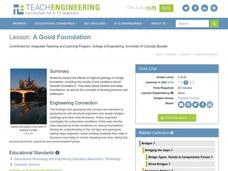
A Good Foundation
It takes a strong foundation to build a house and a stronger one for a bridge. This resource presents the effects of geology and soil on bridge foundations. Working in groups, the class investigates the interaction of shallow and deep...
Teach Engineering
Archimedes' Principle, Pascal's Law and Bernoulli's Principle
What do Pascal's law, Archimedes' Principle, and Bernoulli's Principle have to do with fluid mechanics? The included PowerPoint presentation provides the basic definitions and equations associated with the three. A set of homework...
Teach Engineering
Electricity and Magnetic Fields
Introduce your class to the idea of magnetic fields around electrical wires with an activity that provides the information about the direction of a magnetic field around a wire carrying an electric current.
Teach Engineering
Designing Bridges
Introduces your class to the types of loads experienced by a bridge. Groups calculate the ultimate load combinations to determine the maximum load requirement. Using this information, builders then determine the amount of material...
EngageNY
Comparing Distributions
Data distributions can be compared in terms of center, variability, and shape. Two exploratory challenges present data in two different displays to compare. The displays of histograms and box plots require different comparisons based...
Teach Engineering
Show Me the Money
Class members learn how to estimate the total costs involved to design and build a bridge by including design, material, equipment, and labor costs. The activity includes a discussion about the trade-off between cost and aesthetics.
Sea World
Endangered Species
Study different endangered species with several activities that incorporate math, science, language arts, and research strategies. A great addition to your activity on conservation or Earth Day.
Charleston School District
Review Unit 1: Exponents
What will be on the test? The resource provides comprehensive review items for the content of the unit on exponents. The resource divides the sections in the order you present the lessons during the unit.
Virginia Department of Education
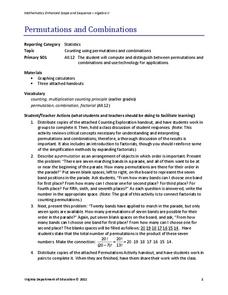
Permutations and Combinations
Counting is not all it adds up to be — sometimes it involves multiplying. The lesson introduces permutations and combinations as ways of counting, depending upon whether order is important. Pupils learn about factorials and the formulas...
Curated OER
Math Cross--Puzzle #11
In this time worksheet, learners fill in a crossword puzzle as they solve twenty-eight addition, subtraction and multiplication problems involving days, weeks and hours.
Teach Engineering
Microfluidic Devices and Flow Rate
When you have to flow, you have to flow. The activity introduces class members to microfluidic devices and their uses in medicine. They watch a short video on how the diameter affects the rate of flow. The worksheet has individuals...
Statistics Education Web
Saga of Survival (Using Data about Donner Party to Illustrate Descriptive Statistics)
What did gender have to do with the survival rates of the Donner Party? Using comparative box plots, classes compare the ages of the survivors and nonsurvivors. Using the same method, individuals make conclusions about the...
NASA
Lights on the International Space Station
Groups explore illumination with NASA's Lighting Environment Test Facility (LETF) as a context. Using the TI-Nspire app, groups determine the lux equation that models their simulation. They then use the lux equation to...
Curated OER
Solving a Simple Maze
It is a-maze-ing how lost one can get. Teams reconstruct a simple maze and solve it. Participants create an algorithm that a robot would follow in order to solve the maze as well. The activity includes an extension directing pupils to...
Statistics Education Web
Text Messaging is Time Consuming! What Gives?
The more you text, the less you study. Have classes test this hypothesis or another question related to text messages. Using real data, learners use technology to create a scatter plot and calculate a regression line. They create a dot...
University of Utah
Explore Proportional and Linear Relationships
Progress from proportional relationships to linear functions. Pupils first review concepts of proportionality covered in earlier grades. They then extend these concepts to linear functions, such as determining the slope of a...


