Granite School District
7th Grade CCSS Math Vocabulary Word List
Address key vocabulary in the seventh grade Common Core Math Standards with this comprehensive list. A series of word cards is also provided that supports each term with images and examples, making this an excellent tool for teaching the...
Charleston School District
Graphing Functions
How do letters and numbers create a picture? Scholars learn to create input/output tables to graph functions. They graph both linear and nonlinear functions by creating tables and plotting points.
Mt. San Antonio Collage
Quadratic Functions and Their Graphs
Starting with the basics, learners discover the features of a parabola and the ways to accurately graph it. After pupils practice with graphing, the end of the worksheet focuses on application type problems.
Ohio Literacy Resource Center
Solving Systems of Linear Equations Graphing
Do you need to graph lines to see the point? A thorough lesson plan provides comprehensive instruction focused on solving systems of equations by graphing. Resources include guided practice worksheet, skill practice worksheet,...
Curated OER
Math Handbook: Trigonometry
You'll be spinning in unit circles once you read through this jumbo-sized resource of everything you need to know about trigonometry. Each page has color-coded examples with explicit directions that detail the problems and...
Modesto Junior College
Graphical Transformations of Functions
Transform your knowledge from average to excellent with this comprehensive guide to function transformations. All of the types of shifts, stretches, and reflections are included with an explanation and coordinating graph to show...
Curated OER
Pre-Calculus Review Sheet
Pre-Calculus has some detailed formulas involved and here is a great resource that lumps then all together for you. Broken up into rectangular, polar, and parametric sections, the conics all include formulas and graphs.
Charleston School District
Sketching a Piecewise Function
How do you combine linear and nonlinear functions? You piece them together! The lesson begins by analyzing given linear piecewise functions and then introduces nonlinear parts. Then the process is reversed to create graphs from given...
Willow Tree
Systems of Equations
Now that learners figured out how to solve for one variable, why not add another? The lesson demonstrates, through examples, how to solve a linear system using graphing, substitution, and elimination.
Charleston School District
The Distance Between Points
Find the shortest distance from A to B using the Pythagorean Theorem! Scholars learn they can find the distance between two points by creating a right triangle using the horizontal and vertical lengths and applying the Pythagorean...
Del Mar College
Solving Systems of Equations
Lets keep the system working and show learners the three ways to solve linear systems of equations. Each method includes step-by-step instructions to work their way through the problem. The same problem is used for each method to show...
Virginia Department of Education
How Much is that Tune?
Tune in for savings! Scholars investigate pricing schemes for two different online music download sites. After comparing the two, they determine the numbers of songs for which each site would be cheaper.
West Contra Costa Unified School District
Sneaking Up on Slope
Pupils determine the pattern in collinear points in order to determine the next point in a sequence. Using the definition of slope, they practice using the slope formula, and finish the activity with three different ways to...
Geophysical Institute
Latitude and Longitude with Google Earth
Travel the world from the comfort of your classroom with a lesson that features Google Earth. High schoolers follow a series of steps to locate places all over the earth with sets of coordinates. Additionally, they measure the distance...
Charleston School District
3D Applications of the Pythagorean Theorem
How many right triangles can you find in a prism, cone, or pyramid? Using right triangles to find lengths in three-dimensional figures is the focus of the lesson. After working with the Pythagorean Theorem to find missing side...
Willow Tree
Midpoint and Distance Formulas
The shortest distance between two points is a straight line. Learners use the Pythagorean Theorem to develop a formula to find that distance. They then find the midpoint using an average formula.
Willow Tree
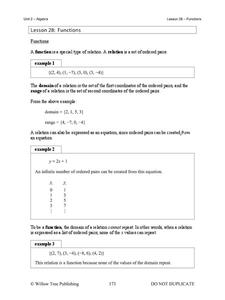
Functions
What makes a function a function? Learn the criteria for a relation defined as a function both numerically and graphically. Once young mathematicians define a function, they use function notation to evaluate it.
Willow Tree
Transformations
How does something go from here to there? Describe it with a transformation. Young mathematicians learn how to translate, reflect, rotate, and dilate an image.
University of Georgia
University of Georgia: Inter Math: Coordinates
This site discusses coordinates in the Cartesian plane. The site gives some fundamental terms involving Cartesian coordinates and a graph with the origin and a point labeled. Be sure to follow the links to related terms, everyday...
Paul Dawkins
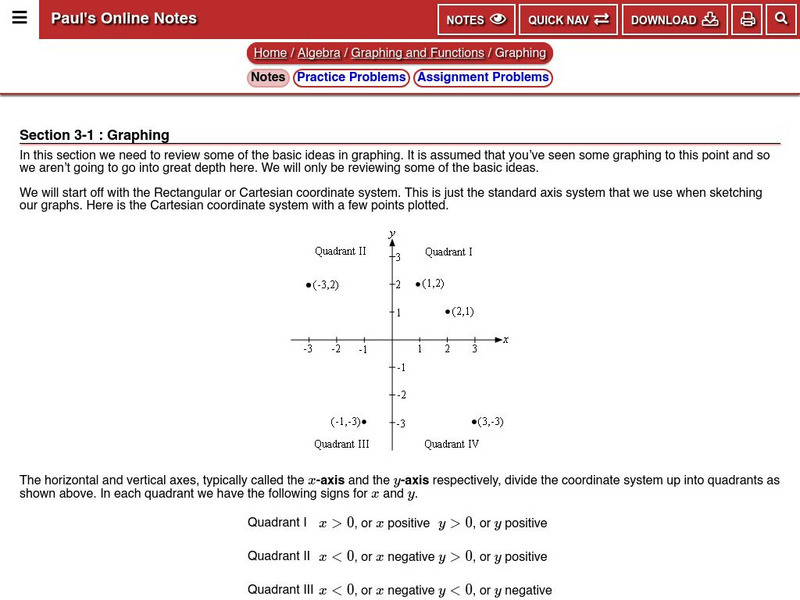
Paul's Online Notes: Algebra: Graphing
Detailed math tutorial features notes and examples that take a look at the Cartesian (or Rectangular) coordinate system. Provides definitions of ordered pairs, coordinates, quadrants, and x and y-intercepts.
Math Open Reference
Math Open Reference: Coordinate Plane
Learn about the coordinate plane with this reference guide. Provides detailed definitions, examples, and an interactive activity that enhances further explanation.
Johan Claeys
Math Abundance: Polar Coordinates of a Point P
Defines a polar coordinate, pole, and polar axis. Includes graph.
Other
Dans Math: Lessons: Trigonometry
College professor Dan Bach reviews basic trig concepts, including trig functions, right triangles, circles, radians, and polar coordinates. Site includes animated graphs and detailed examples.
Other
Dans Math: Lessons: Calculus (Part 2)
College professor Dan Bach offers a review of the calculus concepts of integrals and vectors. Examples and animated graphs are provided.


