Gatsby Charitable Foundation
Four Activities Using Straight Line Graphs
This math packet includes four different activities which puts linear equations and line of best fit in the context of real world applications. Each activity uses a different linear math modeling equation and asks the learners to...
Education Institute
Four Mathematics Lessons for Grade 9
These four lesson plans build algebra skills for working with numbers in exponential form and for examining triangles. Be aware that in the text, scientific notation is referred to as index notation and the laws of exponents as the laws...
CK-12 Foundation
Graphs for Discrete and for Continuous Data: Discrete vs. Continuous Data
Not all data is the same. Using the interactive, pupils compare data represented in two different ways. The learners develop an understanding of the difference between discrete and continuous data and the different ways to represent each...
CK-12 Foundation
Misleading Graphs (Identify Misleading Statistics): Are Virgos Cursed?
Is it safe to take data at its face value? Pupils use the interactive to evaluate a claim that Virgos are more likely to get into a car crash than others. Individuals determine whether another variable may be at play.
CK-12 Foundation
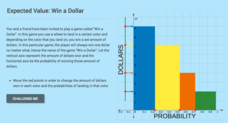
Expected Value: Win a Dollar
Spin a wheel, land on a color ... and win. Learners create a graph to display the probabilities of the amount of money they can win by spinning a colored wheel. The pupils use the dollar amounts and their probabilities to calculate the...
CK-12 Foundation
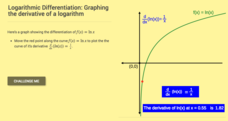
Logarithmic Differentiation: Graphing the Derivative of a Logarithm
Log the values of the derivative of a logarithm. The interactive plots the derivative of the natural logarithm. Learners first determine the derivative of natural logarithm and the general logarithm. Using the formulas for the...
Curated OER
Shapes on a grid #1
Before learning about the coordinate plane and ordered pairs, have kids get used finding locations on the grid. They are given a simple set of coordinates, which they will locate on the grid. A great way to introduce the concept.
CK-12 Foundation
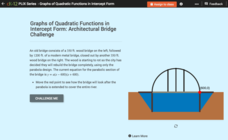
Graphs of Quadratic Functions in Intercept Form: Architectural Bridge Challenge
There are architectural parabolas all around us! A creative lesson analyzes the architecture of a parabolic bridge. Learners must manipulate the bridge to satisfy given criteria and then answer questions about the dimensions of the...
College Board
2010 AP® Calculus BC Free-Response Questions Form B
Keep moving along a curve. Two items in the set of released free-response questions from the 2010 AP® Calculus BC exam involve movement along a graph. One involves particle motion along a polar curve while the other uses a squirrel...
Math Moves U
Collecting and Working with Data
Add to your collection of math resources with this extensive series of data analysis worksheets. Whether your teaching how to use frequency tables and tally charts to collect and organize data, or introducing young...
Inside Mathematics
Coffee
There are many ways to correlate coffee to life, but in this case a instructional activity looks at the price of two different sizes of coffee. It requires interpreting a graph with two unknown variables, in this case the price, and...
California Academy of Science
California's Climate
The United States is a large country with many different climates. Graph and analyze temperature and rainfall data for Sacramento and Washington DC as you teach your class about the characteristics of Mediterranean climates. Discuss the...
Curated OER
Flicking Football Fun
Young mathematicians fold and flick their way to a deeper understanding of statistics with a fun, hands-on math unit. Over the course of four lessons, students use paper footballs to generate data as they learn how to create line...
Willow Tree
Histograms and Venn Diagrams
There are many different options for graphing data, which can be overwhelming even for experienced mathematcians. This time, the focus is on histograms and Venn diagrams that highlight the frequency of a range of data and overlap of...
West Contra Costa Unified School District
Quadratic Equations — What We Know
Everything you could possibly want to know about quadratic equations, all in one resource. Instructors demonstrate how to translate between different forms of quadratics (equation, table of values, graph, verbal description) and finding...
American Statistical Association
What Fits?
The bounce of a golf ball changes the result in golf, mini golf—and a great math activity. Scholars graph the height of golf ball bounces before finding a line of best fit. They analyze their own data and the results of others to better...
Mathematics Assessment Project
Shelves
Don't leave this task on the shelf — use it is assess middle schoolers understanding of patterns. Participants try to discover a pattern in the number of bricks and planks used to make shelves. They then match descriptions...
Yummy Math
Which Sweet Heart Candy Is the Best Deal?
Get the most Valentine's candy for your money with a fun math activity! After examining three deals for buying candy hearts in bulk, young mathematicians decide which deal is the best and use bar graphs to demonstrate their claim. They...
Howard County Schools
Planning for Prom
Make the most of your prom—with math! Pupils write and use a quadratic model to determine the optimal price of prom tickets. After determining the costs associated with the event, learners use a graph to analyze the break even point(s).
Houghton Mifflin Harcourt
Four-Quadrant Grid
Give your graphers a complete grid to neatly organize their coordinates and lines without having to draw one on their own. This four-quadrant grid provides labeled markers for each line up to -10 and +10 in all directions.
Mathematics Assessment Project
College and Career Readiness Mathematics Test B1
Math was easier before it got mixed up with the alphabet. A 10-page test covers material from multiple years of high school math. Scholars demonstrate knowledge across domains with a mixture of short answer and applied problems.
Mathematics Assessment Project
Bike Ride
As a middle school assessment task, learners interpret the graph of distance versus time for a bike ride. Pupils then determine distance of the trip, length of the trip, and speeds.
CCSS Math Activities
Smarter Balanced Sample Items: 7th Grade Math – Target E
How well do your classes understand scale? You'll certainly know after they answer the set of eight questions from an informative and helpful presentation. Questions include items from coordinate geometry, similar triangles, and scale...
Concord Consortium
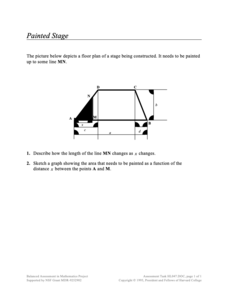
Painted Stage
Find the area as it slides. Pupils derive an equation to find the painted area of a section of a trapezoidal-shaped stage The section depends upon the sliding distance the edge of the painted section is from a vertex of the trapezoid....

