EngageNY
Solving General Systems of Linear Equations
Examine the usefulness of matrices when solving linear systems of higher dimensions. The lesson plan asks learners to write and solve systems of linear equations in four and five variables. Using matrices, pupils solve the systems and...
EngageNY
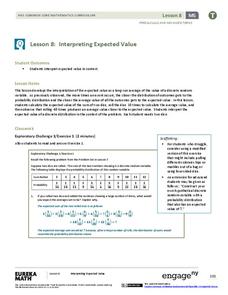
Interpreting Expected Value
Investigate expected value as a long-run average. The eighth installment of a 21-part module has scholars rolling pairs of dice to determine the average sum. They find aggregate data by working in groups and interpret expected value as...
Kenan Fellows
Dinner Party: Using Pattern Trains to Demonstrate Linear Functions
Nothing fancy here ... just your run-of-the-mill Algebra party! Learners explore the patterns of linear functions while designing seating arrangements for a dinner party. Comparing the number of tables to the perimeter of the combined...
Illustrative Mathematics
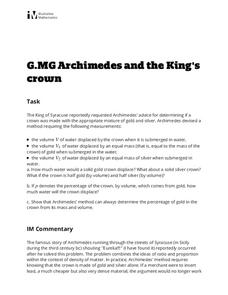
Archimedes and the King's Crown
Learners will shout "Eureka!" in this quick but deep activity replicating the famous bathtub experiment of Archimedes. Given the scenario of a king with a suspected fake crown, young investigators develop formulas using density to...
Mrs. Burke's Math Page
The Amazing Pi Race
Add a sense of excitement to your math class with this race across the country. Using their knowledge of all things circular, young mathematicians work in pairs answering a series of pi-related word problems as they hop from one city to...
EngageNY
Evaluating Reports Based on Data from a Sample
Statistics can be manipulated to say what you want them to say. Teach your classes to be wise consumers and sort through the bias in those reports. Young statisticians study different statistical reports and analyze them for...
Illustrative Mathematics
The Napping House
How many people and animals can cram into a single bed? Find out with this cross-curricular math and language arts lesson. Following along with a reading of the children's book The Napping House by Audrey Wood, young mathematicians...
Mathematics Vision Project
Circles: A Geometric Perspective
Circles are the foundation of many geometric concepts and extensions - a point that is thoroughly driven home in this extensive unit. Fundamental properties of circles are investigated (including sector area, angle measure, and...
Achieve
False Positives
The test may say you have cancer, but sometimes the test is wrong. The provided task asks learners to analyze cancer statistics for a fictitious town. Given the rate of false positives, they interpret the meaning of this value in the...
PBS
Adding Integers
Your sixth and seventh graders deepen their understanding of a number line and adding integers in this concrete, hands-on activity. Learners play "Warehouse Puzzle" and then discuss their game strategies and the characteristics...
Curated OER
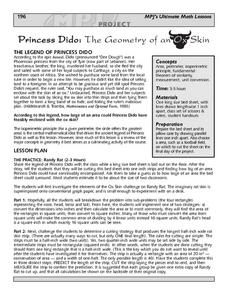
The Geometry Of An Ox Skin
High schoolers investigate the concepts of area and perimeter. The lesson plan uses a legend to create a context for the proposed word problem. They use the skill of estimation in order to create an ox skin that is found in the story.
Illustrative Mathematics
Weather Graph Data
Teaching young mathematicians about collecting and analyzing data allows for a variety of fun and engaging activities. Here, children observe the weather every day for a month, recording their observations in the form of a bar graph....
Bowland
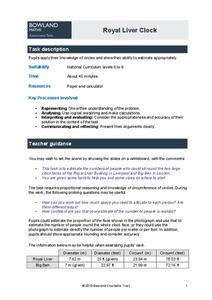
Royal Liver Clock
Using clocks as dining tables? Scholars estimate the number of people that can sit around the face of the clock on the Royal Liver Building in Liverpool. They use estimation to justify their responses.
Bowland
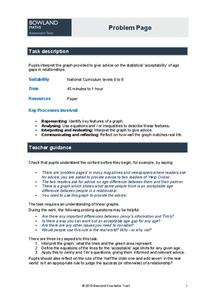
Problem Page
Future mathematicians use a given graph to answer a question about age differences in relationships. Along the way, they must find the equation and inequality of given graphs.
Bowland
Speedy Santa
Santa sure is fast. In the assessment task, learners calculate the number of minutes Santa can spend at each house. This calculation requires the use of given population demographics data.
Project Maths
Correlation Coefficient
Of course, there might be a correlation! Young mathematicians investigate several different data sets, create scatter plots, and determine any correlation. They consider whether a causation exists between any of the variables in question.
Curated OER
US Airports, Assessment Variation
Determining relationships is all part of algebra and functions. Your mathematicians will decide the type of relationship between airports and population and translate what the slope and y-intercept represent. The problem is multiple...
Mascil Project
Circular Pave-Stones Backyard
Pack the lesson into your plans. Young mathematicians learn about packing and optimization with the context of circular paving stones. They use coins to model the paving stones, and then apply knowledge of circles and polygons to...
Balanced Assessment
Ford and Ferrari
Which is faster, a Ford or a Ferrari? The short assessment has pupils analyze graphs to determine the rates of change between the two. Individuals interpret the rates of change within the context of speeds of the cars and develop a map...
Concord Consortium
Catching Up
Class members have some catching up to do. Given a linear equation describing the distance of a runner, young mathematicians interpret the equation in terms of the context. They consider a general equation of the same form and describe...
NASA
Lights on the International Space Station
Groups explore illumination with NASA's Lighting Environment Test Facility (LETF) as a context. Using the TI-Nspire app, groups determine the lux equation that models their simulation. They then use the lux equation to...
Balanced Assessment
Solar Elements
Let your brilliance shine like the sun. Future mathematicians and scientists consider given data on the abundance of different elements in the sun. The assessment task requires consideration of how these different abundances relate to...
Bowland
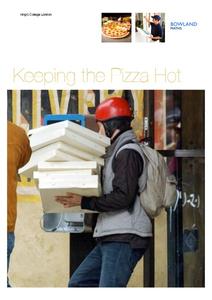
Keeping the Pizza Hot
Learners conduct an experiment to develop a cooling curve for pizza. They consider how this affects pizza delivery in terms of packing material, distance, and delivery routes.
Shodor Education Foundation
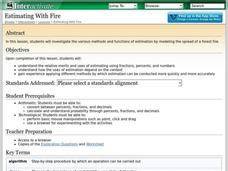
Estimating With Fire
Watch the damage from a forest fire in this interactive simulation activity that challenges learners to estimate the burn area using different approaches. Learners are given a worksheet to track the different burn patterns and practice...

