American Statistical Association
EllipSeeIt: Visualizing Strength and Direction of Correlation
Seeing is believing. Given several bivariate data sets, learners make scatter plots using the online SeeIt program to visualize the correlation. To get a more complete picture of the topic, they research their own data set and perform an...
5280 Math
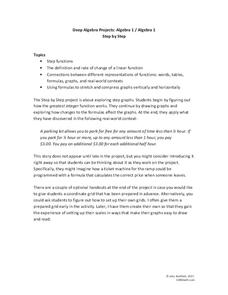
Step by Step
One step at a time! A seemingly linear relationship becomes an entirely new type of function. Young scholars build their understanding of step functions by completing a three-stage activity that incorporates multiple representations of...
EngageNY
Two Graphing Stories
Can you graph your story? Keep your classes interested by challenging them to graph a scenario and interpret the meaning of an intersection. Be sure they paty attention to the detail of a graph, including intercepts, slope,...
EngageNY
First-Person Computer Games
How do graphic designers project three-dimensional images onto two-dimensional spaces? Scholars connect their learning of matrix transformations to graphic design. They understand how to apply matrix transformations to make...
EngageNY
Types of Statistical Studies
All data is not created equal. Scholars examine the different types of studies and learn about the importance of randomization. They explore the meaning of causation and when it can be applied to data.
EngageNY
Four Interesting Transformations of Functions (Part 4)
What do you get when you cross piecewise functions with transformations? An engaging lesson! The conclusion of a four-part series on the transformations of functions asks class members to apply transformations to piecewise...
Bowland
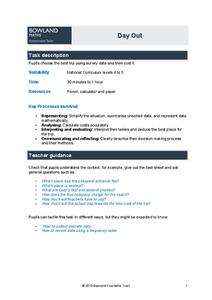
Day Out
Use mathematics to help plan a field trip. Scholars use the results of a survey to determine where a class should go on a field trip. They use provided data about entrance fees and mileage to calculate the cost per person of such a...
Bowland
Soft Drinks
"Statistics are no substitute for judgment" - Henry Clay. Young mathematicians use provided statistics from a soda taste test to explain why conclusions are faulty. They devise a new test that would be more appropriate than the one given.
California Academy of Science
California's Climate
The United States is a large country with many different climates. Graph and analyze temperature and rainfall data for Sacramento and Washington DC as you teach your class about the characteristics of Mediterranean climates. Discuss the...
Willow Tree
Measurement
Build a basic understanding of units of measure and create a great foundation for your learners. The activity gives a complete overview of everything measurement, from types of measurement to rounding to conversions — it has it all!
Illustrative Mathematics
Banana Bread
Show your future bakers how to choose the right baking pan by calculating the volume of a pan. The resource compares two pans, one with decimal edge lengths and is too small for the recipe and one that may work. Your number crunchers are...
PBL Pathways
Lake Pollution
Explain the timing of a lake cleanup to the EPA using calculus. A project-based learning opportunity has learners compare rate functions to compute a total change. Their solutions explain the time needed to rid a lake of pollutants.
Mathematics Assessment Project
Table Tiling
How many total tiles does it take to tile a table top? Learners apply geometric concepts to determine the number of tiles needed for a specific square table top, and then use the result to create expressions for the number of tiles...
Mathematics Assessment Project
Best Buy Tickets
Everyone wants the best price when shopping — no matter what they are trying to buy. Given pricing information, pupils must solve a system of equations to determine the best option for printing tickets.
Mathematics Assessment Project
Yogurt
Daily production of dairy? Determine profit and production requirements for a yogurt company with unit conversions and percentages to solve problems.
Mathematics Assessment Project
Bike Ride
As a middle school assessment task, learners interpret the graph of distance versus time for a bike ride. Pupils then determine distance of the trip, length of the trip, and speeds.


