EngageNY
Piecewise and Step Functions in Context
Looking for an application for step functions? This activity uses real data to examine piecewise step functions. Groups create a list of data from varying scenarios and create a model to use to make recommendations to increase...
Curated OER
The Gum Drop
Students find the area of three figure by the traditional formulaic methods. Then they count the number of grid squares to double check. They show an intuitive sense of Pick's Algorithm by counting every two boundary squares as one unit....
EngageNY
Creating and Solving Quadratic Equations in One Variable
Give your classes practice at modeling using quadratic models with a resource that uses area and integer problems to allow individuals to create second degree polynomials. Young mathematicians solve equations using factoring and then...
California Education Partners
Colorful Data
Scale up your lessons with a performance task. Young data analysts work through an assessment task on scaled bar graphs. They answer questions about a given scaled bar graph on favorite colors, analyze a bar graph to see if it matches...
Curated OER
Measures of Central Tendency Using Scientific Calculators
Learners explore mean, median, and mode as they model mathematics in real-world problem situations. The lesson requires the use of the TI 30X IIS.
Curated OER
Repeating Decimal as Approximation
You are used to teaching repeating decimals with bar notation that keeps us from writing that number over and over again; now teach what the over and over again represents. This activity allows your mathematicians to explore the infinite...
National Nanotechnology Infrastructure Network
Scale Models
With instructions to adapt the activities for any grade K-12, any teacher can incorporate the concept of scale into the classroom with a simple, yet effective lesson.
Howard County Schools
Constant Rate Exploration
Question: What do rectangles and bathtub volume have in common? Answer: Linear equations. Learn how to identify situations that have constant rates by examining two different situations, one proportional and one not proportional.
Curated OER
Picture Board
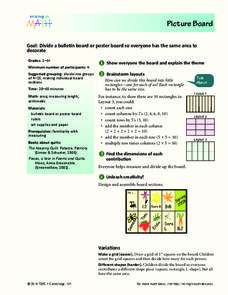
Learners divide a poster board so everyone gets the same amount of area to decorate. Youngsters talk about the different ways to divide a rectangle. They measure their lines to make sure that each piece is equal and then decorate their...
Curated OER
Marshmallow Figures
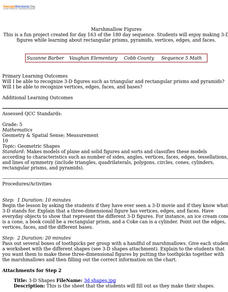
Students enjoy making 3-D figures while learning about rectangular prisms, pyramids, vertices, edges, and faces. After a lecture/demo, students use marshmallows, toothpicks and a worksheet imbedded in this lesson plan to create 3...
Curated OER
Slope-Intercept Form of a Line
Using the subscriber website Explorelearning.com, young mathematicians observe changes in the slope and y-intercept and their effect on the graph of lines. This activity helps learners develop an intuitive sense of the connection between...
American Statistical Association
How Tall and How Many?
Is there a relationship between height and the number of siblings? Classmates collect data on their heights and numbers of brothers and sisters. They apply statistical methods to determine if such a relationship exists.
Mathematics Assessment Project
Representing Inequalities Graphically
A new, improved version of the game Battleship? Learners graph linear inequalities on the coordinate plane, then participate in a game where they have to guess coordinate points based on the solution to a system of linear...
Noyce Foundation
The Wheel Shop
Teach solving for unknowns through a problem-solving approach. The grouping of five lessons progresses from finding an unknown through simple reasoning to solving simultaneous equations involving three and four variables. Each lesson...
American Statistical Association
Scatter It! (Predict Billy’s Height)
How do doctors predict a child's future height? Scholars use one case study to determine the height of a child two years into the future. They graph the given data, determine the line of best fit, and use that to estimate the height in...
California Mathematics Project
Reflections
Reflections are the geometric mirror. Pupils explore this concept as they discover the properties of reflections. They focus on the coordinates of the reflections and look for patterns. This is the third lesson in a seven-part series.
American Statistical Association
How Fast Are You?
Quick! Snap up the lesson. Scholars first use an online app to collect data on reaction times by clicking a button when the color of a box changes. They then plot and analyze the data by considering measures of center, measures of...
Curated OER
Putting the Pieces Together
Children explore fractions on a conceptual level by making individual quilt squares. Each student works with small paper swatches to divide them into pieces that represent a given fraction. The class is then separated into groups and...
Curated OER
Area, Perimeter and Rations Using Pentominoes
Learners of all ages investigate area and perimeter through pentominoes. In this geometry lesson, students calculate the are and perimeter of different geometric shapes and describe the properties of similar and congruent shapes. This...
101 Questions
Trashketball
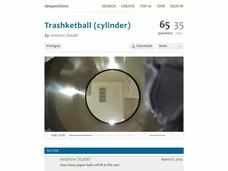
Take a shot using a lesson on volume! Young learners watch a video showing a trashcan filling with paper balls. The task is to calculate the number of paper balls that will fit in the can. Pupils use volume calculations to make a...
American Statistical Association
You and Michael
Investigate the relationship between height and arm span. Young statisticians measure the heights and arm spans of each class member and create a scatter plot using the data. They draw a line of best fit and use its slope to explain the...
Illustrative Mathematics
US Garbage, Version 1
An interesting example of a discrete function and how it is applies to the real world. This could easily make a good collaborative lesson with an environmental science class. Practice reading a table and drawing a scatter plot make up...
Curated OER
Sphere Dressing
Geometric design makes a fashion statement! Challenge learners to design a hat to fit a Styrofoam model. Specifications are clear and pupils use concepts related to three-dimensional objects including volume of irregular shapes and...
Curated OER
I Can Build It.....Yes I Can!
Kindergartners listen to a story read by their teacher, then use magnetic shape pieces to construct simple designes. They "build" their own house using pre-cut paper shapes. This age-appropriate lesson would be an excellent choice for...


