PBS
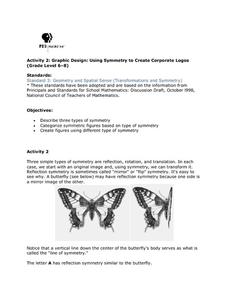
Using Symmetry to Create Corporate Logos
Young mathematicians investigate the use of symmetry in graphic design. After first learning about reflection, translational, and rotational symmetry, children use this new knowledge to identify symmetry in letters of the...
Noyce Foundation
The Wheel Shop
Teach solving for unknowns through a problem-solving approach. The grouping of five lessons progresses from finding an unknown through simple reasoning to solving simultaneous equations involving three and four variables. Each lesson...
California Education Partners
Animals of Rhomaar
Investigate the growth rates of alien animals. Pupils study fictional animals from another planet to determine how much they grow per year. The investigators plot the growth of their animals over a period of time and then compare...
101 Questions
Trashketball
Take a shot using a lesson on volume! Young learners watch a video showing a trashcan filling with paper balls. The task is to calculate the number of paper balls that will fit in the can. Pupils use volume calculations to make a...
101 Questions
CoinStar
Would you rather have a bowl of dimes or a bowl of quarters? A video introduces the problem by presenting two bowls, one full of quarters and another full of dimes. Learners use information from a CoinStar receipt to calculate the number...
California Education Partners
Theater Field Trip
Here's an assessment task that's better than watching a show. Young mathematicians solve word problems involving multiplication and division with equal groups. They must find the total number of attendees on a trip to a theater based on...
American Statistical Association
How Tall and How Many?
Is there a relationship between height and the number of siblings? Classmates collect data on their heights and numbers of brothers and sisters. They apply statistical methods to determine if such a relationship exists.
American Statistical Association
Scatter It! (Predict Billy’s Height)
How do doctors predict a child's future height? Scholars use one case study to determine the height of a child two years into the future. They graph the given data, determine the line of best fit, and use that to estimate the height in...
Statistics Education Web
It’s Elemental! Sampling from the Periodic Table
How random is random? Demonstrate the different random sampling methods using a hands-on activity. Pupils use various sampling techniques to choose a random sample of elements from the periodic table. They use the different samples to...
Education Development Center
Integer Combinations—Postage Stamps Problem (MS Version)
Number patterns can seem mysterious. Help your learners unravel these mysteries as they complete an intriguing task. Through examination, collaborative groups determine that they are able to produce all integers above a certain...
Education Development Center
Choosing Samples
What makes a good sample? Your classes collaborate to answer this question through a task involving areas of rectangles. Given a set of 100 rectangles, they sample a set of five rectangles to estimate the average area of the figures. The...
Education Development Center
Finding Triangle Vertices
Where in the world (or at least in the coordinate plane) is the third vertex? Given two coordinate points for the vertices of a triangle, individuals find the location of the third vertex. They read an account of fictional...
Education Development Center
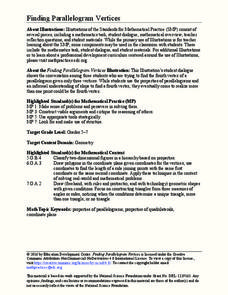
Finding Parallelogram Vertices
Four is the perfect number—if you're talking about parallelograms. Scholars determine a possible fourth vertex of a parallelogram in the coordinate plane given the coordinates of three vertices. They read a conversation...
Howard County Schools
Generous Aunt
Witness the power of exponential growth with an activity that investigates two different savings plans. Class members create tables of values to see how and when a savings plan increasing exponentially exceeds one increasing linearly.
Howard County Schools
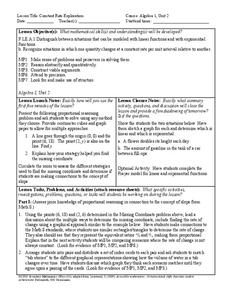
Constant Rate Exploration
Question: What do rectangles and bathtub volume have in common? Answer: Linear equations. Learn how to identify situations that have constant rates by examining two different situations, one proportional and one not proportional.
American Statistical Association
Bubble Trouble!
Which fluids make the best bubbles? Pupils experiment with multiple fluids to determine which allows for the largest bubbles before popping. They gather data, analyze it in multiple ways, and answer analysis questions proving they...


