Curated OER
Connect the Mathematical Dots
Teachers can choose visual activities that demonstrate the elegance associated with the coordinate plane.
Curated OER
Animal Parade
In this activity, students will work with positional words, reinforcing their understanding of the terms; left, right, before, after, between, first, and last.
Willow Tree
Graphing
So many methods and so little time! The efficient method of graphing a linear equation depends on what information the problem gives. Pupils learn three different methods of graphing linear equations. They graph equations using...
EngageNY
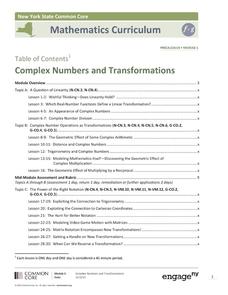
Complex Numbers and Transformations
Your learners combine their knowledge of real and imaginary numbers and matrices in an activity containing thirty lessons, two assessments (mid-module and end module), and their corresponding rubrics. Centered on complex numbers and...
Balanced Assessment
Local and Global Behavior
Create rules for numerical sequences. Pupils develop local rules and recursive rules for number sequences. The sequences are linear, quadratic, and cubic in nature. Scholars find that some local rules do not work, no matter where in...
Illustrative Mathematics
Which Weighs More? Which Weighs Less?
Expand the the comparative language of young mathematicians with a hand-on weight measurement activity. Working independently or in pairs, children compare the weight of large wooden blocks to various other classroom objects, recording...
5280 Math
Multiplication Table Algebra
Patterns, patterns, everywhere! Young scholars examine the multiplication table to identify patterns. Their exploration leads to an understanding of the difference of squares and sum of cubes by the completion of the algebra project.
Mathematics Vision Project
Module 6: Trigonometric Functions
Create trigonometric functions from circles. The first lesson of the module begins by finding coordinates along a circular path created by a Ferris Wheel. As the lessons progress, pupils graph trigonometric functions and relate them to...
Balanced Assessment
Number Trick
Show your classes the magic of numbers. Using a number trick, learners practice writing algebraic expressions. They then use their expression to perform the trick. Their exploration should help them understand the magic behind the trick.
Curated OER
US Households
Learners construct and use inverse functions to model a real-world context. They use the inverse function to interpolate a data point.
EngageNY
Graphs of Piecewise Linear Functions
Everybody loves video day! Grab your class's attention with this well-designed and engaging resource about graphing. The video introduces a scenario that will be graphed with a piecewise function, then makes a connection to domain...
EngageNY
Copy and Bisect an Angle
More constructions! In this third installment of a 36-part series, learners watch a YouTube video on creating door trim to see how to bisect an angle. They then investigate how to copy an angle by ordering a given list of steps.
Curated OER
Starting With Stats
Statisticians analyze a data set of student IQs by finding measures of central tendency and dispersion such as mean, median, mode, and quartiles. They practice using a graphing calculator to find the values and analyze box plots and...
Curated OER
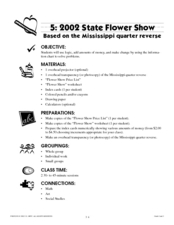
2002 State Flower Show
Here is another State Quarter instructional activity. This one uses the Mississippi State Quarter. Pupils utilize beautifully-designed worksheets embedded in the plan, to practice calculating which combinations of flowers they can afford...
American Statistical Association
How Fast Are You?
Quick! Snap up the instructional activity. Scholars first use an online app to collect data on reaction times by clicking a button when the color of a box changes. They then plot and analyze the data by considering measures of center,...
Curated OER
Bar Graphs and Line Graphs
In this bar graphs and line graphs worksheet, students examine given data, organize it, and create bar graphs and line graphs from the given information. They interpret graphs and write statements explaining the graph. This one page...
PBL Pathways
Medical Insurance
Design a plan for finding the best health insurance for your money. Learners compare two health plans by writing and graphing piecewise functions representing the plan rules. Using Excel software, they create a technical report...
Illustrative Mathematics
Congruent Triangles
Geometers prove that triangle PQR is congruent to triangle ABC by describing any combination of rotations, reflections, and translations that would prove it so. There is only this single task on the handout, but a detailed explanation of...
Illustrative Mathematics
Offensive Linemen
Comparing college football teams, Division I is said to have heavier lineman than Division III. Your mathematicians are given data from two different divisions and will have to interpret a dotplot and calculate the difference in weight...
Illustrative Mathematics
Buying Bananas, Assessment Version
Practice with unit rates, proportions, and ratios when Carlos purchases an amount of bananas. Learners must interpret a graph to decide whether points on the same line represent similar proportional relationships. Use with lesson plans...
Curated OER
Snail Invasion
Exponential growth is modeled by learners as they analyze and interpret the data presented in this real-life scenario centered on the destructive invasion of the Giant African Land Snail. Learners get a touch of history and practice...
Curated OER
Describing Data
Your learners will practice many ways of describing data using coordinate algebra in this unit written to address many Common Core State Standards. Simple examples of different ways to organize data are shared and then practice problems...
Achieve
Spread of Disease
Viruses can spread like wildfire, and mathematics can model the speed of infection. Given a function, scholars analyze it to describe the spread of a disease within a stadium. Learners find the initial number infected and the maximum...
West Contra Costa Unified School District
Exploring Quadratics and Graphs
Young mathematicians first graph a series of quadratic equations, and then investigate how various parts of the equation change the graph of the function in a predictable way.


