Curated OER
Counting Coins
Second graders identify a quarter, dime, penny, nickel, and dime. They match the coin with it's monetary value, collect data on excel spreadsheet, and create a graph in Excel. Students participate in group activities.
Curated OER
Markup and Discount
Seventh graders observe and demonstrate how to calculate markups and discounts including markup percentages and discount percentages. They observe a teacher-led demonstration, then in pairs read scenarios and independently complete...
West Contra Costa Unified School District
Simplifying Fractions Activity
Warm-up pupils' fraction muscles with a four-question quiz, then delve into a learning game designed to reinforce the concept of simplifying fractions. Based on the "I do, We do, You do" method of teaching, the instructional...
West Contra Costa Unified School District
Graphing Linear Inequalities Sort
Learners first determine the slope-intercept and standard forms of inequalities given graphs, and then determine key features of the graphs.
EngageNY
Experiments with Inscribed Angles
Right angles, acute angles, obtuse angles, central angles, inscribed angles: how many types of angles are there? Learners first investigate definitions of inscribed angles, central angles, and intercepted arcs. The majority of the...
EngageNY
Special Triangles and the Unit Circle
Calculate exact trigonometric values using the angles of special right triangles. Beginning with a review of the unit circle and trigonometric functions, class members use their knowledge of special right triangles to find the value...
Bowland
Magic Sum Puzzle
Learners discover the magic in mathematics as they solve numerical puzzles involving magic sums. They then make a conjecture as to why no additional examples are possible based on an analysis of the puzzles.
Curated OER
Properties of Matrices
A TI-nspire lesson to find determinants of matrices using calculators. The class follows along in this step by step activity to explore operations on matrices. They will mostly be multiplying and at the end of the lesson they are guided...
Curated OER
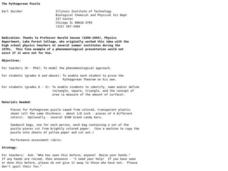
The Pythagorean Puzzle
An engaging hands-on activity is presented. Learners of all ages are addressed in thie unique plan. K-5 learners identify, name, and define a rectangle, square, triangle, and the concept of area. Older learners prove the Pythagorean...
Curated OER
Representing Data 1: Using Frequency Graphs
Here is a lesson plan that focuses on the use of frequency graphs to identify a range of measures and makes sense of data in a real-world context as well as constructing frequency graphs given information about the mean, median, and...
Curated OER
Representing Data 2: Using Box Plots
What information can be gleaned from a box and whiskers plot? Discuss the five summary values - minimum, maximum, upper and lower quartiles, and median - and what conclusions can be made from these values? Included here is a matching...
Curated OER
Introduction to Exponents
Problem solve using exponents. Pupils read One Grain of Rice: A Mathematical Folktale and write powers to represent amounts from the story.They compare actual solutions to their predictions and play a game to practice using...
Bowland
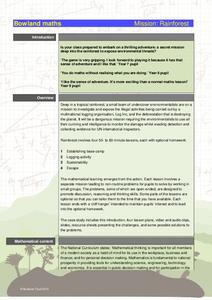
Mission: Rainforest
Young environmentally conscious mathematicians solve a variety of problems related to the central theme of uncovering illegal logging activities. They determine a base camp based on given constraints, investigate logging activities and...
02 x 02 Worksheets
Absolute Value Equations and Inequalities
Demonstrate the meaning of an absolute inequality using three different methods. Here, scholars explore absolute value inequalities through graphing, number line distance, and compound inequalities. Pupils complete various activities to...
Teach Engineering
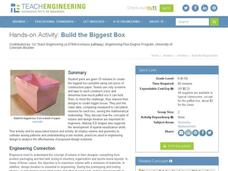
Build the Biggest Box
Boxing takes on a whole new meaning! The second installment of the three-part series has groups create lidless boxes from construction paper that can hold the most rice. After testing out their constructions, they build a new box....
Kenan Fellows
Saving Those Who Save Us: Exploring the Use of Sensors with Data Visualization
Sensor technology is amazingly accurate and useful. Combining the sensor technology and mathematical knowledge, scholars design experiments to answer a question they have developed. Questions may focus on light sensing, temperature...
Curated OER
World of the Pond
Field trip! The class will review what they know about organisms that dwell in freshwater ponds, then trek down to the old water hole to collect specimens for examination. This includes several web links, useful tips, and an excellent...
Curated OER
Race to the Top
Here is a game that will help your young mathematicians practice number recognition and writing numbers. Played with a spinner or dice, individual learners or a pair will play this fun number game. They will roll the die or spin the...
Mathematics Vision Project
Geometric Figures
Logical thinking is at the forefront of this jam-packed lesson, with young mathematicians not only investigating geometric concepts but also how they "know what they know". Through each activity and worksheet, learners wrestle with...
Curated OER
Put Your Truss in Building Bridges
Students apply abstract concepts, such as stress, fulcrums, the law of gravity, and the strength of different geometric shapes. Groups of student contractors operate simulated architectural firms to create strong, economical bridges.
Curated OER
Proving (a Theorem) and Disproving (a Theory)
As a cross-curricular lesson, your class examines the issues of gender discrimination, careers, and gender roles. They read and discuss an article, prepare a proof of the Pythagorean theorem as a class, and develop a creative...
Curated OER
History of Toys and Games
Students research history of popular toys to learn when those toys were first introduced. They use measurement skills to create an accurate timeline.
Curated OER
How Many Raisins?
Students study the concept of addition. They create verbal number stories with numbers from one to five. They draw a slice of bread with a line down the middle and cut the bread shapes out of a "slice of bread" and a handful of raisins,...
Curated OER
Data Analysis
Young statisticians use and interpret measures of center and spread such as mean, median, and mode as well as range. They use box plots to represent their data and answer questions regarding the correspondence between data sets and the...


