Curated OER
Mean, Median, and Mode
Students find the mean, median, and mode for a set of data. They define terms and find examples, as well as complete practice exercises. They work cooperatively to analyze real data from a variety of websites provided. To...
Curated OER
Many Meanings
Second graders listen to the book, Play Ball Amelia Bedelia, and find words in the story that have more than one meaning. In this language arts lesson, they write four words that have multiple meanings on the worksheet embedded in the...
Curated OER
Practice With Multiple-Meaning Words
Second graders work with multiple meaning words. They participate in a teacher led lesson about words with have more than one meaning. Everyone completes a skill building worksheet in which sentences using words with more than one...
EngageNY
Using a Curve to Model a Data Distribution
Show scholars the importance of recognizing a normal curve within a set of data. Learners analyze normal curves and calculate mean and standard deviation.
Curated OER
Mean, Variance, and Standard Deviation for the Binomial Distribution
Students review previous lessons on mean, variance, standard deviation, and expected value. They utlize formulas for these characteristics that are specifically designed for the binomial distribution. Students discuss the similarities...
California Academy of Science
Kinesthetic Astronomy: The Meaning of a Year
How many times have you traveled around the sun? Aspiring astronomers grasp what a year is and they differentiate between orbit and rotation by walking around the sun right within your classroom. Place a lamp in the center of the room to...
Curated OER
Drive the Data Derby
Three days of race car design and driving through the classroom while guessing probability could be a third graders dream. Learn to record car speed, distances traveled, and statistics by using calculation ranges using the mean, median,...
Curated OER
Reinvigorate Your Vocabulary
Eighth graders participate in a variety of activities to examine the meanings and roots of word derivatives and the meanings of words. Using context clues, they determine the meanings of words omitted from a passage and complete a prefix...
Curated OER
It's Greek to Me!
Use Greek roots, suffixes, and prefixes to create polysyllabic words. Readers use the dictionary to identify what the word's prefix, suffix, and root or base word mean. They define what a syllable is and how one is formed using Greek...
Curated OER
Data Analysis
Young statisticians use and interpret measures of center and spread such as mean, median, and mode as well as range. They use box plots to represent their data and answer questions regarding the correspondence between data sets and the...
Curated OER
Starting With Stats
Statisticians analyze a data set of student IQs by finding measures of central tendency and dispersion such as mean, median, mode, and quartiles. They practice using a graphing calculator to find the values and analyze box plots and...
American Chemical Society
Setting the Standards of Excellence
A number doesn't have much meaning without a standard of reference. Learners read about the history of developing standards to measure chemical and physical properties and complete reading guides to process the information. They focus on...
EngageNY
Margin of Error When Estimating a Population Mean (part 2)
Don't leave your classes vulnerable in their calculations! Help them understand the importance of calculating a margin of error to represent the variability in their sample mean.
Statistics Education Web
Walk the Line
How confident are you? Explore the meaning of a confidence interval using class collected data. Learners analyze data and follow the steps to determine a 95 percent confidence interval. They then interpret the meaning of the confidence...
Virginia Department of Education
Organizing Topic: Data Analysis
Learners engage in six activities to lead them through the process of conducting a thorough analysis of data. Pupils work with calculating standard deviations and z-scores, finding the area under a normal curve, and sampling techniques....
EngageNY
Margin of Error When Estimating a Population Mean (part 1)
We know that sample data varies — it's time to quantify that variability! After calculating a sample mean, pupils calculate the margin of error. They repeat the process with a greater number of sample means and compare the results.
EngageNY
Graphing Quadratic Functions from the Standard Form
Use context to explain the importance of the key features of a graph. When context is introduced, the domain and range have meaning, which enhances understanding. Pupils use application questions to explore the key features of the graph...
EngageNY
Measuring Variability for Symmetrical Distributions
How do we measure the deviation of data points from the mean? An enriching activity walks your class through the steps to calculate the standard deviation. Guiding questions connect the steps to the context, so the process is not about...
American Statistical Association
Bear Hugs
Scholars research arm span to determine who gives the best bear hugs. They use data from a national study to find the standard statistics for arm span. It includes mean, median, quartiles, spread, standard deviation, and more.
Georgia Department of Education
Math Class
Young analysts use real (provided) data from a class's test scores to practice using statistical tools. Not only do learners calculate measures of center and spread (including mean, median, deviation, and IQ range), but also use this...
EngageNY
Describing the Center of a Distribution
So the mean is not always the best center? By working through this exploratory activity, the class comes to realize that depending upon the shape of a distribution, different centers should be chosen. Learners continue to explore the...
Willow Tree
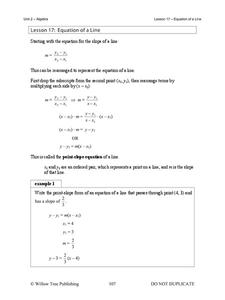
Equations of a Line
Each form of a linear equation has its purpose — pupils just have to find it. Building on the previous lesson in the series, learners examine point-slope and standard form. Using point-slope form, pupils write the equation of a...
Discovery Education
By the Foot: The History of Measurement
When is a foot not a foot? When you use the length of your own foot to measure distances, of course. To underscore the importance of standardized units of measurement, middle schoolers engage in a series of activities that ask them to...
Curated OER
Reading For Meaning
Select an article that explores people of another culture. After reading it as a class, distribute copies of this worksheet. It asks for a brief summary, encourages readers to make text-to-self connections, and asks learners to identify...


