Curated OER
Mathemafish Population
It's shark week! In this problem, young mathematically minded marine biologists need to study the fish population by analyzing data over time. The emphasis is on understanding the average rate of change of the population and drawing...
Willow Tree
Line Graphs
Some data just doesn't follow a straight path. Learners use line graphs to represent data that changes over time. They use the graphs to analyze the data and make conclusions.
Curated OER
Algebra 1: Slope as Rate
Young scholars solve problems with slopes. In this algebra lesson, students identify the slope of a line and relate it to the rate of change. They graph their lines on the TI and observe changes in the lines.
BW Walch
Creating and Graphing Linear Equations in Two Variables
This detailed presentation starts with a review of using key components to graph a line. It then quickly moves into new territory of taking these important parts and teasing them out of a word problem. Special care is taken to discuss...
Texas Instruments
Finding Linear Models Part III
Explore linear functions! In this Algebra I lesson, mathematicians graph data in a scatter plot and use a graphing calculator to find a linear regression and/or a median-median line. They use the model to make predictions.
Curated OER
Slope, Vectors, and Wind Pressure
A hands-on lesson using the TI-CBR Motion Detector to provide information to graph and analyze. The class uses this information to calculate the slope of motion graphs and differentiate scalar and vector quantities. There is a real-world...
CK-12 Foundation
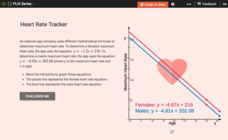
Graphs of Linear Systems: Heart Rate Tracker
Max out heart rates for males and females. Formulas of maximum heart rates provide the equations for a linear system. Pupils use the interactive to graph the equations for males and females and determine their points of intersection. The...
Curated OER
Equations from Unit Rates
Your class can become linear equations masters, as they calculate the rate of change of a function. They observe different types of coordinates as they relate to a graph, then use the Ti-navigator to move the line around and draw...
EngageNY
Representations of a Line
Explore how to graph lines from different pieces of information. Scholars learn to graph linear functions when given an equation, given two points that satisfy the function, and when given the initial value and rate of change. They solve...
Curated OER
Environmental Agents of Mathematics: Mathematics for Change
High schoolers analyze environmental science data using Math. They do research about renewable energy, gather data, create graphs and interpret their findings. Then the group presents their arguments persuasively using their findings to...
Balanced Assessment
Bathtub Graph
Represent the relationship between independent and dependent variables through a modeling situation. The activity expects learners to graph the volume of water in a bathtub during a given scenario. The graph should result in two areas of...
Illustrative Mathematics
Find the Change
This exercise is an opportunity for algebra learners to understand the connection between the slope of a line and points found on the line. Use similar triangles to explain why slope m is the same between any two points. Discuss with the...
Inside Mathematics
Vencent's Graphs
I like algebra, but graphing is where I draw the line! Worksheet includes three multiple-part questions on interpreting and drawing line graphs. It focuses on the abstract where neither axis has numbers written in, though both are...
Willow Tree
Bar Graphs
Circles, lines, dots, boxes: graphs come in all shapes in sizes. Scholars learn how to make a bar graph using univariate data. They also analyze data using those bar graphs.
CK-12 Foundation
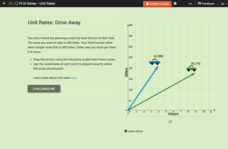
Comparison of Unit Rates: Drive Away
Five questions make up an interactive that challenges mathematicians to compare unit rates. Word problems question scholars about two friends going on a road trip. Scholars manipulate two cars on a coordinate plane to help solve word...
California Mathematics Project
Meteorology
See how estimation is essential to making temperature weather maps. Scholars use ratios and rates of change to estimate temperatures at locations where temperature readings have not been made. They connect this idea to linear functions.
Curated OER
Slope as a rate of change
In this Algebra I/Algebra II activity, students examine the slope of line as the rate of change between the dependent and independent variables. The one page activity contains two multiple choice questions. Answers are included.
Curated OER
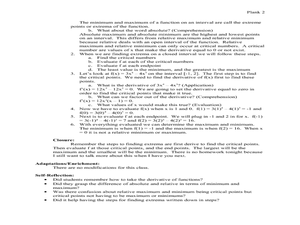
Extrema on an Interval
Students explore maximum and minimum points, slopes and tangents. In this Pre-Calculus lesson, students solve optimization problems and find rates of change.
Curated OER
Polly and the Shapeshifter
Students analyze the patterns in polygons and relate it to the rate of change. In this algebra lesson, students discuss the relationship between the data and the graph of the data.
EngageNY
Two Graphing Stories
Can you graph your story? Keep your classes interested by challenging them to graph a scenario and interpret the meaning of an intersection. Be sure they paty attention to the detail of a graph, including intercepts, slope,...
Balanced Assessment
Multi-Graphs
So many things change as time goes by. Here, scholars create graphs based on this premise. Each problem asks pupils to sketch a graph that describes a given situation. Their graphs represent various characteristics such as height,...
EngageNY
Interpreting Quadratic Functions from Graphs and Tables
Seeing functions in nature is a beautiful part of mathematics by analyzing the motion of a dolphin over time. Then take a look at the value of a stock and maximize the profit of a new toy. Explore the application of quadratics by...
Curated OER
Lessen the Loan
Middle-schoolers explore the concept linear equations. They use the internet to navigate through videos and problems. Pupils problem solve to determine rates of change, slope, and x and y-intercepts.
Curated OER
Discovering Different Types of Functions
Graph polynomials and identify the end behavior of each polynomial function. The class differentiates between linear, quadratic, and other polynomial equations.


