EngageNY
Summarizing Bivariate Categorical Data with Relative Frequencies
It is hard to determine whether there is a relationship with the categorical data, because the numbers are so different. Working with a familiar two-way table on super powers, the class determines relative frequencies for each...
Flipped Math
Frequency Tables
What's the association? Pupils watch a presentation on creating a two-way frequency table. Learners find out how to calculate relative frequencies within the table to determine whether there is an association between the two categories....
EngageNY
Conditional Relative Frequencies and Association
It is all relative, or is it all conditional? Using an exploration method, the class determines whether there is an association between gender and superpower wish through the use of calculating conditional relative frequencies. The...
Curated OER
Frequency Distributions
In this statistics worksheet, students solve 5 frequency problems. In four of the problems, the frequency table is provided and students construct one relative frequency table, one cumulative frequency table, and two cumulative relative...
Mathed Up!
Two Way Tables
When presented with categorical data, a two-way frequency table is a great way to summarize the information. Pupils organize categorical data using a two-way table, then use the tables to determine missing data and to calculate simple...
Charleston School District
Two-Way Tables
Do males or females buy more iPhones? Using a two-way frequency table can help to answer this question. Pupils learn to create two-way frequency tables and then how to analyze the data within the tables. Learners find frequencies,...
EngageNY
Describing a Distribution Displayed in a Histogram
The shape of the histogram is also relative. Learners calculate relative frequencies from frequency tables and create relative frequency histograms. The scholars compare the histograms made from frequencies to those made from relative...
Mathed Up!
Probability and Relative Frequency
Go ahead and take a chance. Given the probability of an event, scholars determine the frequency of the event out of a sample. The part of a review series for the General Certificate of Secondary Education math assessment asks classmates...
EngageNY
The Difference Between Theoretical Probabilities and Estimated Probabilities
Flip a coin to determine whether the probability of heads is one-half. Pupils use simulated data to find the experimental probability of flipping a coin. Participants compare the long run relative frequency with the known theoretical...
Noyce Foundation
Ducklings
The class gets their mean and median all in a row with an assessment task that uses a population of ducklings to work with data displays and measures of central tendency. Pupils create a frequency chart and calculate the mean and median....
Inside Mathematics
Winning Spinners
Winning a spin game is random chance, right? Pupils create a table to determine the sample space of spinning two spinners. Individuals determine the probability of winning a game and then modify the spinners to increase the probability...
Flipped Math
Unit 5 Review: Bivariate Data
The data says it's a wrap. Pupils work through four review questions with multiple parts dealing with bivariate data. Questions cover creating and interpreting two-way tables and scatter plots with lines of best fit. Scholars finish up...
Bowland
German or English?
Sprechen sie Deutsch? Future cryptographers must decide whether an unknown text is written in English or in German. They use provided pie charts about the frequency of words in the English and German languages to help make their decisions.
Curated OER
Tally Chart Practice
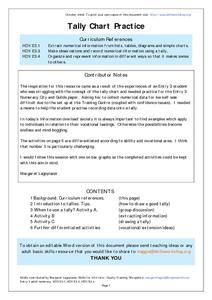
In this tally chart worksheet, students will read about tally charts and their uses. Students will make a list of when and why they could make a tally chart. Next students will complete a tally chart and write statements about the...
Curated OER
Froot Loops to the Max - 1
Middle schoolers complete and solve five questions related to a box of Froot Loops cereal. First, they determine how many of each color of Froot Loops and which color has the greatest and least frequency. Then, pupils write the fraction...
Curated OER
Froot Loops to the Max - 2
In this Froot Loops to the max worksheet, learners complete and solve 5 problems related to a box of Froot Loops cereal. First, they determine how many of each color is represented in the box of Froot Loops. Then, students determine...
Inside Mathematics
Suzi's Company
The mean might not always be the best representation of the average. The assessment task has individuals determine the measures of center for the salaries of a company. They determine which of the three would be the best representation...
Statistics Education Web
You Will Soon Analyze Categorical Data (Classifying Fortune Cookie Fortunes)
Would you rely on a fortune cookie for advice? The lesson plan first requires future statisticians to categorize 100 fortune cookie fortunes into four types: prophecy, advice, wisdom, and misc. The lesson plan goes on to have learners...
Statistics Education Web
I Always Feel Like Somebody's Watching Me
Future statisticians and potential psychics first conduct an experiment to collect data on whether a person can tell if someone is staring at them. Statistical methods, such as hypothesis testing, chi-square tests, binomial tests, and...
Curated OER
Plasma Clouds in Space and Density
Use this plasma clouds worksheet to have learners find the density of 10 different plasma clouds using a given formula which uses the reflection frequency to determine the density.
Curated OER
Typical Conceptual Questions for Physics I - Light and Quantum
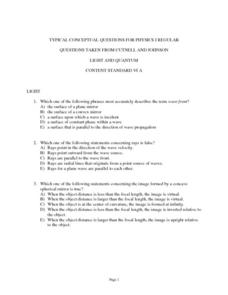
This is a stellar overview of everything light and quantum! There are 30 multiple choice questions, none of them requiring any mathematical computation. There are a few diagrams to analyze: light rays striking reflective and refractive...
Curated OER
Froot Loops to the Max - 3
Learners complete and solve five questions/problems related to a box of Froot Loops cereal. First, they determine how many of each color of Froot Loops are in the box. Then, pupils determine which color had the greatest frequency and...
Curated OER
Chemistry 301
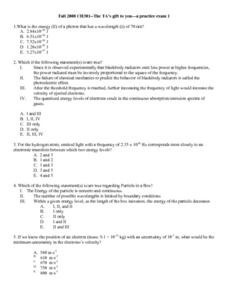
In this chemistry 301 worksheet, students answer questions as it relates to the electron configuration of given elements. Students use the periodic table to assist in their interpretation of the questions provided.
Curated OER
Pictograms
Have your class practice using a pictogram with this resource. Learners count tally marks, and answer a few questions related to the graph. Afterwards, they could create their own pictograms.


