Yummy Math
A Cardioid for Valentine’s Day
It's Valentine's Day in geometry class! Celebrate the day of love with a heart-themed activity in which young mathematicians create a cardioid on polar graph paper.
Curated OER
Your Tax Dollars at Work
In order to understand how tax dollars are spent, young economists use given data and graph it on a circle graph. Circle graphs are highly visual and can help individuals describe data. A class discussion follows the initial activity.
Curated OER
Apple Logic and Problem Solving
Learners examine apple production in the United States. For this interdisciplinary lesson, students use problem solving strategies introduced to solve math problems associated with apple production in the United States. Student collect...
Curated OER
Making Graphs
Students explore statistics by conducting class demographic surveys. In this graph making lesson, students identify the family members of each classmate, pets they own, and favorite activities. Students organize their statistics and...
Curated OER
The Gathering and Analysis of Data
Young mathematicians gather data on a topic, graph it in various forms, interpret the information, and write a summary of the data. They present their data and graphs to the class.
Council for the Curriculum, Examinations and Assessment
Learning About Learning
Successful people know that they never stop learning. Eighth graders explore their preferred ways to learn new information with a reflective lesson about learning styles, that features surveys, writing prompts, and...
Curated OER
If It's to Be, It's Up to Me!
Eighth graders discuss the question: How does one become an effective decision-maker or problem solver in social situations? They are given three brief scenarios and after each one students are asked, "What would you do?" Students think...
Curated OER
Graphing Regions: Lesson 2
Students identify and analyze geographical locations of inventors. They each identify where their inventor is from on a U.S. map, discuss geographic patterns, and create a t-chart and graph using the Graph Club 2.0 Software.
Curated OER
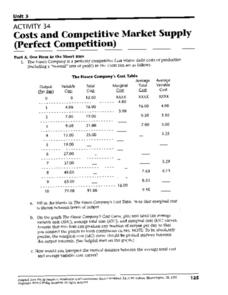
Costs and Competitive Market Supply
In this economics worksheet, students are presented with tables and diagrams for a fictitious company, then must answer questions, solve problems, plot and label graphs, and make predictions based on information provided.
Curated OER
The Sum of Our Integer Intelligences
Young mathematicians explore integers. They review adding integers through engaging in mathematical labs. Each lab station is designed to reflect one of the multiple intelligences. Resources for all activities are provided.
Curated OER
Dealing with Peer Influence: What Are Bullying and Harassment? Lesson 1 of 2
Fifth graders review definitions of bullying and harassment, respond to real-life bullying scenario from news, television, or movie, brainstorm possible solutions and consequences for negative behavior, and discuss how their peers...
Curated OER
Keynesian Equilibrium Without Government
In this Keynesian instructional activity, students complete a table, plot functions on a graph, answer questions, solve problems, and make predictions about scenarios with variables.
Curated OER
Excise Taxes
Challenge your class with this activity relating to the excise tax. They examine a variety of graphs and diagrams, solve problems, and make predictions.
Curated OER
A Thanksgiving Survey
Young scholars take a survey then use the information gained from the survey to help plan a typical Thanksgiving dinner for our last day of class. They create a graph which corresponds the the data gathered during interviews.
Curated OER
Money Circulation: A Story of Trade and Commerce
Students are introduced to the meaning, symbolism, and value of the quarter. They determine the percentage of total monetary value held in quarters and graph the results. Students infer about the U.S. Mint's distrubution of coins. They...
Curated OER
Local Traffic Survey
Students conduct a traffic survey and interpret their data and use graphs and charts to display their results.
Curated OER
Mapping with a Compass: A Simulated Survey
Students use compasses and grids to map the locations of artifacts found in a simulated dig site. In groups, they role-play as future archeologists excavating a school site. Groups begin at their assigned datum and site the artifacts...
Curated OER
Population Pyramids
Students utilize population pyramids to answer questions, make comparisons, draw conclusions and support predictions about the populations of China, India and the Unites States. They arrange numbers and symbolic information from various...
Curated OER
Is the Hudson River Too Salty to Drink?
Students explore reasons for varied salinity in bodies of water. In this geographical inquiry lesson, students use a variety of visual and written information including maps, data tables, and graphs, to form a hypothesis as to why the...
Curated OER
Voter Turnout
High schoolers solve problems using math. They complete a graph, using data from the 2000 presidential election results. Students predict and calculate the outcome of the election based upon the voting patterns.
Curated OER
Water: From Neglect to Respect
The goal of this collection of lessons is to make middle schoolers more aware of the ways in which they are dependent upon water to maintain their standard of living. Learners compare water use in Lesotho to water use in the United...
Curated OER
Gold Rush California and its Diverse Population
Students compare contemporary cultural differences with historical differences based on population percentage. In this cross-curriculum Gold Rush/math lesson, students analyze aspects of California's Gold Rush population and diversity...
Curated OER
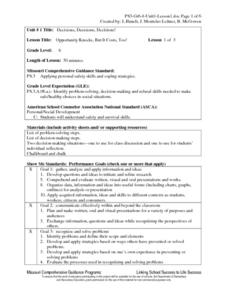
Opportunity Knocks, But It Costs, Too!
Sixth graders write a reflection piece, outlining each of the decision-making steps they have used and what decision they have decided upon, which includes possible solutions, as well as possible outcomes for each solution. They also...
Yummy Math
US Holiday Candy Sales
Candy is a big business! Calculate the amount of money consumers spent on major holidays—Easter, Halloween, Christmas, Hanukkah, and Valentine's Day—based on the total amount of candy sales from 2011 and the percentage of each holiday's...


