Mathed Up!
Distance Time Graphs
If only there was a graph to show the distance traveled over a period of time. Given distance-time graphs, pupils read them to determine the answers to questions. Using the distance and time on a straight line, scholars calculate the...
EngageNY
Getting the Job Done—Speed, Work, and Measurement Units II
How fast is your class? Learners determine the amount of time it takes individuals to walk a given distance and calculate their speeds. Pupils solve distance, rate, and time problems using the formula and pay attention to the...
EngageNY
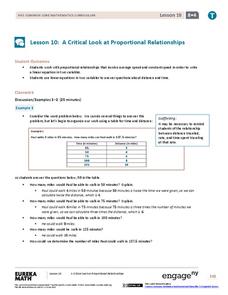
A Critical Look at Proportional Relationships
Use proportions to determine the travel distance in a given amount of time. The 10th installment in a series of 33 uses tables and descriptions to determine a person's constant speed. Using the constant speed, pupils write a linear...
Concord Consortium
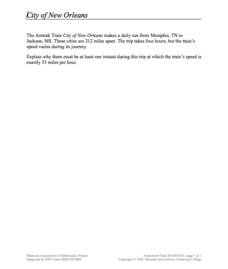
City of New Orleans
In the United States, most trains operate at a top speed of 100 miles per hour. Scholars use information on the distance and time of a train trip to determine if the train ever reaches a specific speed. They connect pieces of information...
Illustrative Mathematics
Friends Meeting on Bikes
It is the job of your mathematicians to figure out how fast Anya is riding her bike when meeting her friend. The problem shares the distance, time spent riding, and Taylor's speed leaving the last variable for your learners to solve. Use...
Illustrative Mathematics
Velocity vs. Distance
At the end of this activity, your number crunchers will have a better understanding as to how to describe graphs of velocity versus time and distance versus time. It is easy for learners to misinterpret graphs of velocity, so have them...
Balanced Assessment
All Aboard
Pupils must graph the location of a train using the time given a timetable. They analyze the different legs of the trip, graph the return trip, and compare the two graphs. The lesson ends with a discussion of similarities and...
Mathed Up!
Compound Measures
Compounding is dividing units. Pupils practice using compound measures such as units for speed and density to solve problems that range from straightforward speed problems to those requiring conversions. The last few items challenge...
Illustrative Mathematics
Running at a Constant Speed
The learner must use the given constant speed to find the unit rate. A table is made in order to relate the speed to the time and the distance. From the table, learners are able to see the unit rate in miles per minute and miles per...
Balanced Assessment
A Run for Two
Develop a graph to represent the distance between two cars. The assessment task presents a scenario in which two cars are traveling at constant speeds with one faster than the other. Pupils develop graphical representations to show the...
Balanced Assessment
Dinner Date
Determine just how far to run before dinner. The short assessment asks pupils to determine the distance a person can jog in the time left before dinner. To answer the question, scholars determine the distance if the person jogs one...
Balanced Assessment
Multi-Graphs
So many things change as time goes by. Here, scholars create graphs based on this premise. Each problem asks pupils to sketch a graph that describes a given situation. Their graphs represent various characteristics such as height,...
Concord Consortium
All-in-All Problems
Graphs, functions, symbols, and more! Use these strategies to model everything from the flow of a river to the number of cars passing a toll booth. Presented differently but solved similarly, learners consider five different scenarios...
Concord Consortium
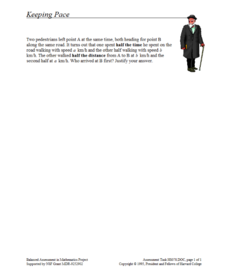
Keeping Pace
What came first, pedestrian one or pedestrian two? Scholars consider a problem scenario in which two people walk at different rates at different times. They must decide who reaches a checkpoint first. Their answers are likely to surprise...
EngageNY
End-of-Module Assessment Task: Grade 8 Module 4
Connect proportional linear equations and systems. The seven-question assessment is the last installment in a 33-part series. The items cover comparing proportional relationships, slope concepts, and simultaneous linear...
Illustrative Mathematics
Writing Constraints
Use this resource to present your number crunchers with how to write a constraint equation and to determine viable solutions. The price of an object limits the amount that can be purchased. The speed at which you walk limits the number...
Curated OER
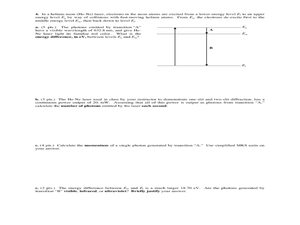
Physics Final Exam
A two-hour final exam covers a range of physics topics related to electricity and magnetism. It employs a variety of methodologies for assessing your physics learners' understanding and mastery of these concepts. You will need to review...
Concord Consortium
Cheetah's Lunch
Run like a cheetah. A performance task challenges pupils to solve several different problems involving the speed of a cheetah. Given information for scenarios where the cheetah chases its prey, they determine if the big cat is fast enough.
Concord Consortium
Center of Population
Let the resource take center stage in a lesson on population density. Scholars use provided historical data on the center of the US population to see how it shifted over time. They plot the data on a spreadsheet to look the speed of its...
Illustrative Mathematics
Running a Mile
The single question in this activity has multiple ways to be solved. Two boys ran a mile. Their times were similar, except one time was a fraction of the other. Who ran faster? In demonstrating the answer to this problem, upper graders...
EngageNY
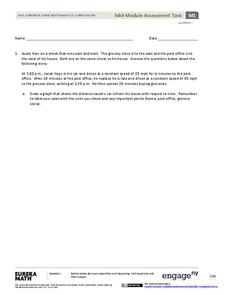
Mid-Module Assessment Task - Algebra 1 (module 1)
Looking for performance tasks to incorporate into your units? With its flexibility, this resource is sure to fit your teaching needs. Use this module as a complete assessment of graphing linear scenarios and polynomial operations, or...
Illustrative Mathematics
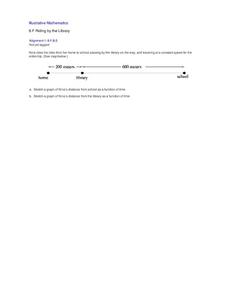
Riding by the Library
Draw a graph that shows the qualitative features of a function that has been described verbally. Make sure learners understand where time is zero and the distance is zero. It may take them some time to understand this concept, so working...
Noyce Foundation
Snail Pace
Slow and steady wins the race? In the assessment task, scholars calculate the rates at which different snails travel in order to find the fastest snail. Hopefully, your class will move much more quickly in finishing the task!
EngageNY
Constant Rates Revisited
Find the faster rate. The resource tasks the class to compare proportional relationships represented in different ways. Pupils find the slope of the proportional relationships to determine the constant rates. They then analyze the...


