American Statistical Association
An A-MAZE-ING Comparison
Teach your class how to use descriptive statistics through a hands-on data collection activity. Pupils collect their own data, calculate test statistics, and interpret the results in context. They compare male and female results, looking...
American Statistical Association
Colors Challenge!
Does writing the name of a color in a different colored ink affect one's ability to read it? Scholars design an experiment to answer this question. They collect the data, analyze the statistics, and draw a conclusion based on...
Statistics Education Web
How High Can You Jump?
How high can your pupils jump? Learners design an experiment to answer this question. After collecting the data, they create box plots and scatter plots to analyze the data. To finish the lesson, they use the data to draw conclusions.
Statistics Education Web
Are Female Hurricanes Deadlier than Male Hurricanes?
The battle of the sexes? Scholars first examine data on hurricane-related deaths and create graphical displays. They then use the data and displays to consider whether hurricanes with female names result in more deaths than hurricanes...
EngageNY
Sampling Variability in the Sample Proportion (part 1)
Increase your sample and increase your accuracy! Scholars complete an activity that compares sample size to variability in results. Learners realize that the greater the sample size, the smaller the range in the distribution of sample...
EngageNY
Sampling Variability in the Sample Proportion (part 2)
Increase your sample and increase your accuracy! Scholars complete an activity that compares sample size to variability in results. Learners realize that the greater the sample size, the smaller the range in the distribution of sample...
Curated OER
View Tube Triangulation
Young scholars investigate a particular object then calculate to find the class average and standard deviation. In this measuring distance lesson students list their calculations on a piece of paper.
American Statistical Association
How Fast Are You?
Quick! Snap up the instructional activity. Scholars first use an online app to collect data on reaction times by clicking a button when the color of a box changes. They then plot and analyze the data by considering measures of center,...
Curated OER
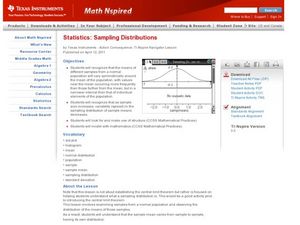
Sampling Distributions
Pupils analyze sampling from different population. For this statistics lesson, students define the meaning of sample sizes and what causes an increase or decrease. They graph their data on the Ti calculator and draw conclusion from the...
Curated OER
Assessing Normalcy
Students define normal distribution as it relates to the bell curve. In this statistics lesson plan, students use the central tendencies of mean, median and mode to solve problems. They plot their data and draw conclusion from the graphs.
Curated OER
Technology vs. Nontechnology
Fourth graders determine the range, mean, median and mode using a computer spreadsheet. An identical set of calculations is done without using a computer. The results of each method are compared. They calculate the mode, median and range...
Curated OER
Weather temperatures
Young scholars investigate the given statistics about temperatures in cities around the nation in order to look for a pattern. They measure the mean, median, and mode for the data set of temperatures.
Curated OER
US Historical Climate: Excel Statistical
Students import US Historical Climate Network mean temperature data into Excel from a station of their choice. They are guided through the activity on how to use Excel for statistical calculations, graphing, and linear trend estimates.
Curated OER
Statistically Lyrical
Students examine and discuss the writing of ratios as fractions and where they can be found in the real world. They complete worksheets and a questionnaire, and calculate the mean, median, and mode scores for the class.
Statistics Education Web
Consuming Cola
Caffeine affects your heart rate — or does it? Learners study experimental design while conducting their own experiment. They collect heart rate data after drinking a caffeinated beverage, create a box plot, and draw conclusions....
Statistics Education Web
Sampling in Archaeology
Compare different random sampling types using an archaeological setting. Scholars collect data from an archaeological plot using simple random samples, stratified random samples, systematic random samples, and cluster random samples....
Statistics Education Web
Saga of Survival (Using Data about Donner Party to Illustrate Descriptive Statistics)
What did gender have to do with the survival rates of the Donner Party? Using comparative box plots, classes compare the ages of the survivors and nonsurvivors. Using the same method, individuals make conclusions about the...
Curated OER
Heartbeat Project
Students enter information about their heartbeats into a spreadsheet. They construct data displays and calculate statistics. They describe and justify their conclusions from the data collected.
Georgia Department of Education
The Basketball Star
Have learners use math to prove they are sports stars! Assess a pupil's ability to create and analyze data using a variety of graphs. The class will be motivated by the association of math and basketball data.
Curated OER
Exploring the Normal Curve Family
Pupils find different characteristics of the bell curve. In this statistics lesson, students analyze a family for a specific characteristic. They identify the shape, center, spread and area as they analyze the characteristic of the...
Curated OER
Transforming Univariate Data
Learners analyze plotted data in this statistics lesson. They differentiate between skewed and normal data. They also explore and interconnect exponential growth and decay as it relates to the data.
Curated OER
Zoo Poo
Students use Internet research to determine the amount of carbon dioxide produced per unit energy for biomass and coal. In this alternative energy lesson, students research to find out how much energy and carbon dioxide several coal and...
Curated OER
Infusing Equity Gender into the Classroom
Students investigate if gender makes a difference in the classroom. In this statistics activity, students collect data on whether equity by gender in the classroom makes students more successful.
West Contra Costa Unified School District
Comparing Data Displays
There is so much more to data than just numbers, and this resource has learners use three methods of comparing data in a multi-faceted lesson plan. The 21-page packet includes a warm-up, examples, an activity, and assessment for a...


