EngageNY
Summarizing Bivariate Categorical Data
How do you summarize data that cannot be averaged? Using an exploratory method, learners complete a two-way frequency table on super powers. The subject matter builds upon 8th grade knowledge of two-way tables.
EngageNY
Solving Equations Using Algebra
Use a tape diagram to emulate the steps of solving equations. The 23rd installment in a 25-part unit presents two-step linear equation problems to solve. Pupils use tape diagrams to solve the problems along with linear equations. To...
EngageNY
Summarizing a Data Distribution by Describing Center, Variability, and Shape
Put those numbers to work by completing a statistical study! Pupils finish the last two steps in a statistical study by summarizing data with displays and numerical summaries. Individuals use the summaries to answer the statistical...
EngageNY
Describing Variability Using the Interquartile Range (IQR)
The 13th activity in a unit of 22 introduces the concept of the interquartile range (IQR). Class members learn to determine the interquartile range, interpret within the context of the data, and finish by finding the IQR using an...
EngageNY
Calculating Probabilities of Events Using Two-Way Tables
Tables are useful for more than just eating. Learners use tables to organize data and calculate probabilities and conditional probabilities.
Statistics Education Web
Saga of Survival (Using Data about Donner Party to Illustrate Descriptive Statistics)
What did gender have to do with the survival rates of the Donner Party? Using comparative box plots, classes compare the ages of the survivors and nonsurvivors. Using the same method, individuals make conclusions about the...
Curated OER
Data Analysis Using Technology
Analyze data using technology. Middle schoolers design data investigations, describe data, and draw their own conclusions. Then they select the best type of graph, graph and interpret the data, and look for patterns in trends. They also...
Curated OER
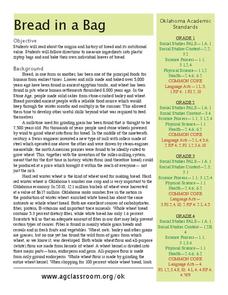
Bread in a Bag
Could the history of bread really be interesting? Yes, it could! An informational text gives scholars wheat production background from 8,000 years ago, discussing different types of bread and the current industry in Oklahoma. Learners...
EngageNY
Problem Solving Using Rates, Unit Rates, and Conversions
Find a way to work with rates. The 23rd part in a 29-part series presents work problems for the class to solve given work rates. Pupils compare rates to determine which is faster. Some problems require learners to convert the rates to...
Utah Education Network (UEN)
Linear Graphs Using Proportions and Rates
Using a TI-73 or other similar graphing calculator middle school math majors investigate the linear relationship of equivalent proportions. After a brief introduction by the teacher, class members participate in a timed pair share...
EngageNY
Describing the Center of a Distribution Using the Median
Find the point that splits the data. The instructional activity presents to scholars the definition of the median through a teacher-led discussion. The pupils use data lists and dot plots to determine the median in sets with even and odd...
Curated OER
Shorten the Length
Learn how to summarize by identifying main ideas and supporting details. Readers cross out unimportant information as they read through a text. Is it a random detail? Cross it out! They then draw a concept map, placing the main idea in...
Teacher's Corner
Hey Batter, Wake Up!
Does jet lag affect a baseball team's performance in games? Read about how a baseball team's chance of winning a game can be affected by traveling over one, two, and three time zones. Readers then respond to five short answer questions...
Georgia Department of Education
Math Class
Young analysts use real (provided) data from a class's test scores to practice using statistical tools. Not only do learners calculate measures of center and spread (including mean, median, deviation, and IQ range), but...
EngageNY
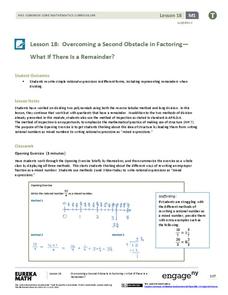
Overcoming a Second Obstacle in Factoring—What If There Is a Remainder?
Looking for an alternative approach to long division? Show your classes how to use factoring in place of long division. Increase their fluency with factoring at the same time!
Statistics Education Web
It Creeps. It Crawls. Watch Out For The Blob!
How do you find the area of an irregular shape? Class members calculate the area of an irregular shape by finding the area of a random sampling of the shape. Individuals then utilize a confidence interval to improve accuracy and use a...
EngageNY
The “WhatPower” Function
The Function That Shall Not Be Named? The eighth installment of a 35-part module uses a WhatPower function to introduce scholars to the concept of a logarithmic function without actually naming the function. Once pupils are...
EngageNY
Mid-Module Assessment Task: Grade 7 Mathematics Module 5
Determine the probability that the class knows probability. The three-question assessment presents problems with finding the sample space and the probability, theoretical and experimental, of a variety of situations. Pupils also describe...
West Contra Costa Unified School District
Square and Square Roots
Root for your pupils to learn about roots. Young mathematicians first review the meaning of squares and square roots. They then use this knowledge to simplify square roots of monomials with variables.
EngageNY
Summarizing a Distribution Using a Box Plot
Place the data in a box. Pupils experiment with placing dividers within a data set and discover a need for a systematic method to group the data. The 14th activity in a series of 22 outlines the procedure for making a box plot based...
EngageNY
Surface Area
Build upon the knowledge of nets to find the surface area of right prisms. Pupils begin to find the area of right rectangular prisms using the net for the prism. They build upon that knowledge to find a general formula that works for all...
Curated OER
How To Measure Area
Geometers learn how to measure the area in square units. They use the floor in the classroom as a visual to measure a square foot area. They use classmates to fill the space and expand the measured area square foot by square foot until...
National Security Agency
It's Probably Probable
Learners make predictions and draw conclusions from given information as they learn the meaning of probability in this vocabulary-rich, integrated activity that presents a variety of teaching strategies to motivate and reach...
EngageNY
Solutions of a Linear Equation
Use the distributive property to solve equations. The sixth lesson plan in a 33-part series has scholars solve equations that need to be transformed into simpler equations first. Class members apply the distributive property to the...
Other popular searches
- Summarizing Using Stellaluna
- Summarizing Using 5 Ws
- Summarizing Using Key Ideas
- Summarizing Using Stealing
- Summarizing Using 5 Sw


