Corbett Maths
Median for a Frequency Table
Try to find the middle of a frequency table. Using a frequency table of ages, the video shows how to use a formula to determine the position of the median. The resource uses frequency tables with both even and odd numbers of data points.
EngageNY
From Ratio Tables to Equations Using the Value of a Ratio
Use the value of a ratio to set up equations. The teacher leads a discussion on determining equations from ratio tables in the 13th portion of a 29-part series. Pupils determine which of two equations to use to find the solution. They...
Charleston School District
Two-Way Tables
Do males or females buy more iPhones? Using a two-way frequency table can help to answer this question. Pupils learn to create two-way frequency tables and then how to analyze the data within the tables. Learners find frequencies,...
Curated OER
Reading Tables
Who is two years younger than Meg? Who is older than Paul, but not Kinta? Scholars practice reading tables as they answer comprehension questions based on three sets of data. First, they examine a table depicting ages, then favorite...
EngageNY
Building Logarithmic Tables
Thank goodness we have calculators to compute logarithms. Pupils use calculators to create logarithmic tables to estimate values and use these tables to discover patterns (properties). The second half of the lesson has scholars use given...
Curated OER
Make a Frequency Table and a Histogram for a Given Set of Data
In this data recording and data organization worksheet, students create one frequency table and one histogram for a given list of data. Explanations and examples for frequency tables and histograms are given.
Curated OER
Graphs to Represent a Data Set
By analyzing a word problem about hours worked in a week, scholars get valuable practice with bar graphs and data analysis. They read the scenario, then examine a table of data taken from it. The data includes four days and the...
Curated OER
Regents High School Examination: Physical Setting Earth Science 2007
This comprehensive earth science practice test is composed of 50 multiple choice questions and 32 short answer questions. The questions cover weather, the water cycle, geology, the solar system, and more. Many of the short answer...
Curated OER
Regents High School Examination: Physical Setting Earth Science 2009
This extensive earth science practice test is composed of 50 multiple choice questions and 31 short answer questions. The questions cover weather, the water cycle, geology, the solar system, and more. Many of the short answer questions...
Education Development Center
Creating a Polynomial Function to Fit a Table
Discover relationships between linear and nonlinear functions. Initially, a set of data seems linear, but upon further exploration, pupils realize the data can model an infinite number of functions. Scholars use multiple representations...
Illustrative Mathematics
Walk-a-thon 1
Your mathematician's job is to explore the relationship between hours and miles walked during a walk-a-thon. The activity compels your learners to experiment with different means in finding out this proportional relationship. The answer...
Illustrative Mathematics
Walk-a-thon 2
During a walk-a-thon your learners must determine the walking rate of Julianna's progress. Using tables, graphs, and an equation, they must be able to calculate the time it took her to walk one mile and predict her distance based on the...
Curated OER
Mixed Tables
Bring out the pegboards for this one! As you introduce multiplication, explain it as sets of objects using these visual practice problems. Learners look at eight pegboards with varying rows filled. For each, they fill in two sentences...
Illustrative Mathematics
Numbers in a Multiplication Table
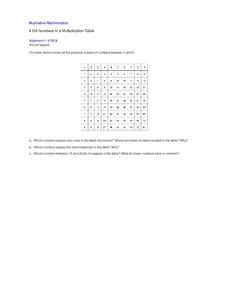
Identifying patterns is a crucial skill for all mathematicians, young and old. Explore the multiplication table with your class, using patterns and symmetry to teach about square numbers, prime numbers, and the commutative and identity...
Inside Mathematics
Conference Tables
Pupils analyze a pattern of conference tables to determine the number of tables needed and the number of people that can be seated for a given size. Individuals develop general formulas for the two growing number patterns and use them to...
Buffalo-Hanover Montrose Schools
Histogram Worksheet
Young mathematicians analyze a given set of numbers to complete a frequency table, and then make a histogram using the data. The worksheet includes three sets of data on the worksheet.
Curated OER
Tables and Graphs Practice
In this table and graph worksheet, students are given three scenarios with data. They construct a table and a graph for each scenario.
Curated OER
Practice the 6s
How fast can your scholars complete 70 multiplication problems from the six times table? They only have to multiply by numbers 1-10, so there are many repeats. Consider setting a goal time or setting up a personal goal system for...
K12 Reader
Setting the Scene: Great Expectations
Expect great things from this reading comprehension exercise that asks readers to cite evidence from the provided passages of Great Expectations to support the inference that Charles Dickens' Miss Havisham, and her room, are indeed strange.
Flipped Math
Unit 5 Review: Bivariate Data
The data says it's a wrap. Pupils work through four review questions with multiple parts dealing with bivariate data. Questions cover creating and interpreting two-way tables and scatter plots with lines of best fit. Scholars finish up...
Curated OER
Regents High School Examination PHYSICAL SETTING CHEMISTRY 2009
In this chemistry worksheet, students answer 50 multiple choice questions and 31 other questions that require them to solve, calculate and write short answers.
Curated OER
Regents High School Examination PHYSICAL SETTING CHEMISTRY 2006
In this chemistry worksheet, high schoolers answer 50 multiple choice questions and 31 short answer questions to prepare for Regents Chemistry Exam.
Curated OER
Regents High School Examination PHYSICAL SETTING CHEMISTRY 2004
For this chemistry worksheet, high schoolers answer 50 multiple choice questions. They solve and write short answer questions to 35 other chemistry related problems.
Curated OER
Regents High School Examination PHYSICAL SETTING CHEMISTRY 2003
In this chemistry worksheet, learners answer 74 multiple choice, short answer and problem solving on various chemistry concepts.


