Curated OER
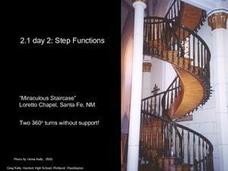
Calculus 2.1 day 2 - Step Functions
"Step functions" are sometimes used to describe real-life situations. This extensive lesson with many practice examples demonstrates two such functions: the Greatest Integer Function and the Least Integer Function. The commands on the...
Curated OER
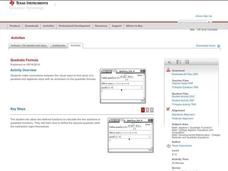
Quadratic Formula
Mathematicians determine the solutions of a quadratic function by looking at a graph. They use the quadratic formula to solve quadratic functions on their Ti-Nspire.
State of Michigan
Pre-K Mathematics
Kick-start children's education with this pre-school math unit. Offering 31 different hands-on learning activities that develop young mathematicians' pattern and shape recognition, basic number sense, and much more, this is a must-have...
Charleston School District
Sketching a Piecewise Function
How do you combine linear and nonlinear functions? You piece them together! The lesson begins by analyzing given linear piecewise functions and then introduces nonlinear parts. Then the process is reversed to create graphs from given...
University of Texas
A Library of Parent Functions
Don't think this lesson is for Mom and Dad; parent functions are all for your high schoolers. Flip through a presentation with a focus slide on each type of graph and its characteristics. Some examples are included but the focus is on...
Charleston School District
Increasing, Decreasing, Max, and Min
Roller coaster cars traveling along a graph create quite a story! The lesson analyzes both linear and non-linear graphs. Learners determine the intervals that a graph is increasing and/or decreasing and to locate maximum and/or minimum...
National Security Agency
Line Plots: Frogs in Flight
Have a hopping good time teaching your class how to collect and graph data with this fun activity-based lesson series. Using the provided data taken from a frog jumping contest, children first work together creating a line plot of the...
NASA
Space Shuttle Ascent: Mass vs. Time
Set the stage for groups of rocket scientists to explore the change in mass of the space shuttle during ascent. Teams work together to graph actual launch data in order to determine the rate of propellent burn.
West Contra Costa Unified School District
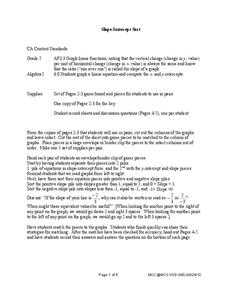
Slope-Intercept Sort
What's so special about slope? Pupils first match cards with slope and y-intercept to graphs of linear equations. They continue the lesson by matching equations in slope-intercept form to the same graphs.
NASA
Weightless Wonder
A video of the weightless wonder provides a setting for the math to follow. Groups analyze the graph of a quadratic function that models the path of the C-9 as it gives astronauts the experience of weightlessness. Using a graphing...
Willow Tree
Histograms and Venn Diagrams
There are many different options for graphing data, which can be overwhelming even for experienced mathematcians. This time, the focus is on histograms and Venn diagrams that highlight the frequency of a range of data and overlap of...
EngageNY
Modeling a Context from Data (part 2)
Forgive me, I regress. Building upon previous modeling activities, the class examines models using the regression function on a graphing calculator. They use the modeling process to interpret the context and to make predictions based...
Inside Mathematics
Swimming Pool
Swimming is more fun with quantities. The short assessment task encompasses finding the volume of a trapezoidal prism using an understanding of quantities. Individuals make a connection to the rate of which the pool is filled with a...
Curated OER
Proof of Identity
Students explore trigonometric identities. In this Algebra II lesson, students use graphing to verify the reciprocal identities. Using Cabri Jr, students investigate the Pythagorean trigonometric identities and the geometric c proofs...
Texas Instruments
Changing Functions
Your algebra 2 learners show what they can do in this assessment activity on shifting, reflecting, and stretching graphs. Given the graphs of various functions, they write the represented equation.
Houghton Mifflin Harcourt
Unit 5 Math Vocabulary Cards (Grade 4)
A set of 49 cards can enhance fourth graders' math vocabulary. It provides a pair of cards on each sheet, one with the word printed in bold text, and the other with the definition of the word. Topics of the cards include mostly...
West Contra Costa Unified School District
Talking About Distance, Rate and Time
Connect the tortoise and the hare fable to mathematics. Learners first identify key terms related to distance, rate, and time. They then solve distance/rate/time problems using different representations.
California Education Partners
Science Fair Project
Plant the data firmly on the graph. Given information about the growth rate of plants, pupils determine the heights at specific times and graph the data. Using the information, scholars determine whether a statement is true and support...
Flipped Math
Unit 5 Review: Systems of Equations
Activate transformers along with algebra systems. Pupils use 10 problems to review transformations of functions to solve a variety of systems of equations. Individuals identify the types of transformations from an equation along with...
Virginia Department of Education
Logarithmic Modeling
Explore logarithms and logarithmic regression. Young mathematicians first learn about inverse functions and about the logarithm function family. They take their newfound knowledge to use logarithmic functions to model situations and...
Shodor Education Foundation
Derivate
Derive tangent lines through derivatives. Scholars use an app to graph functions and investigate derivatives and tangent lines. The interactive automatically graphs a tangent line at a specified point and can also produce tables of values.
Concord Consortium
Maintain Your Composition
Compose yourself! Learners first use given graphs of functions f and g to graph the composition function f(g(x)) and identify its value for a specific input. They then consider functions for which f(g(x)) = g(f(x)).
Charleston School District
Contextualizing Function Qualities
Let the graph tell the story! Adding context to graphs allows learners to analyze the key features of the function. They make conclusions about the situation based on the areas the graph is increasing, decreasing, or has a maximum or...
Mathematics Vision Project
Module 5: Systems of Equations and Inequalities
Systems of equations and inequalities model contextual situations. A set of 12 lessons build a solid understanding of writing and solving systems of equations and inequalities using a variety of methods. The module is the fifth in a...
Other popular searches
- Math Graphs Using M&ms
- Solving Problems Using Graphs
- Using Graphs and Tables
- Predictions Using Graphs
- Report Using Graphs
- Solve Problems Using Graphs
- Estimation Using Graphs
- Problem Solving Using Graphs
- Using Circle Graphs to Display
- Using Graphs to Find Equations
- Bar Graphs Using Excel
- Graphs Using M Icrosoft Excel


