American Statistical Association
EllipSeeIt: Visualizing Strength and Direction of Correlation
Seeing is believing. Given several bivariate data sets, learners make scatter plots using the online SeeIt program to visualize the correlation. To get a more complete picture of the topic, they research their own data set and perform an...
Concord Consortium
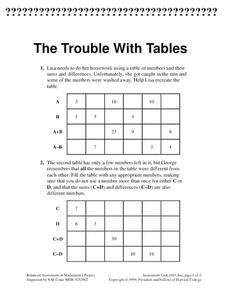
The Trouble with Tables
Tackle these tables. A performance task has learners complete two puzzles using addition and subtraction. They must fill in tables with missing addends, sums, minuends, subtrahends, or differences.
American Statistical Association
Exploring Geometric Probabilities with Buffon’s Coin Problem
Scholars create and perform experiments attempting to answer Buffon's Coin problem. They discover the relationships between geometry and probability, empirical and theoretical probabilities, and area of a circle and square.
5280 Math
Integer Interpreter
Can you add variables if you don't know their value? Using an empty number line, scholars first locate the position of the difference, sum, product, and quotient of two unknown integers. Later problems mix operations as well as add...
5280 Math
Decimal Patterns
Find patterns in the process instead of the result. Learners convert series of decimals and fractions identifying patterns along the way. The lesson includes nine problem tasks with progressively more involved patterns.
American Statistical Association
How Random Is the iPod’s Shuffle?
Shuffle the resource into your instructional activity repertoire. Scholars use randomly-generated iPod Shuffle playlists to develop ideas about randomness. They use a new set of playlists to confirm their ideas, and then decide whether...
American Statistical Association
How Fast Are You?
Quick! Snap up the lesson. Scholars first use an online app to collect data on reaction times by clicking a button when the color of a box changes. They then plot and analyze the data by considering measures of center, measures of...
5280 Math
Capture the Points
Play a game of capture the points. Young scholars receive a number line with specific points graphed and must write an inequality that captures all the points. The second task of the algebra project is to write an inequality with...
5280 Math
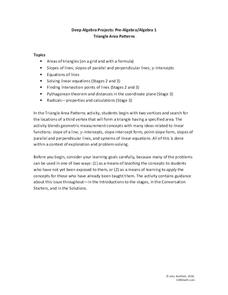
Triangle Area Patterns
Combine algebraic and geometric strategies to find solutions. The task asks learners to find the coordinates of a third vertex of a triangle to create a triangle with a specific area. The project is a set of seven problems that helps...
5280 Math
Multiplication Table Algebra
Patterns, patterns, everywhere! Young scholars examine the multiplication table to identify patterns. Their exploration leads to an understanding of the difference of squares and sum of cubes by the completion of the algebra project.
5280 Math
Factory Functions
Solve a real-life problem using function-building skills. Presented with an open-ended question, scholars complete a checklist to create and justify a solution in an interesting algebra project. The checklist asks for justifications of...
5280 Math
Stories That Formulas Tell
Learn the stories a formula holds. An interesting lesson takes a unique approach to teach how to use formulas. Beginning with a formula, learners predict what the variables stand for and then use the formula to make calculations and tell...
American Statistical Association
Scatter It! (Using Census Results to Help Predict Melissa’s Height)
Pupils use the provided census data to guess the future height of a child. They organize and plot the data, solve for the line of best fit, and determine the likely height and range for a specific age.
American Statistical Association
Step into Statastics
Class members study the size of classmates' feet and perform a statistical analysis of their data. They solve for central tendencies, quartiles, and spread for the entire group as well as subgroups. They then write a conclusion based on...
American Statistical Association
What is the Probability of “Pigging Out”
Learners apply their understanding of luck to a probability experiment. They play a game of Pass the Pigs to determine the probability of a specific outcome. Using analysis for their data, pupils declare the measures of center, dot...
American Statistical Association
Bear Hugs
Scholars research arm span to determine who gives the best bear hugs. They use data from a national study to find the standard statistics for arm span. It includes mean, median, quartiles, spread, standard deviation, and more.
American Statistical Association
Armspans
Young mathematicians collect data on the arm spans of classmates. Then they sort the data by measures of center, spread, and standard deviation. Finally, they compare groups, such as boys and girls, to interpret any differences.
American Statistical Association
What Fits?
The bounce of a golf ball changes the result in golf, mini golf—and a great math activity. Scholars graph the height of golf ball bounces before finding a line of best fit. They analyze their own data and the results of others to better...
American Statistical Association
Happy Birthday to . . . Two?
How many people do you need in a room before two likely share the same birthday? Scholars consider this puzzle by analyzing a set of data. They ponder how to divide the data and determine the proper size of a group for this event to...
American Statistical Association
Bubble Trouble!
Which fluids make the best bubbles? Pupils experiment with multiple fluids to determine which allows for the largest bubbles before popping. They gather data, analyze it in multiple ways, and answer analysis questions proving they...
Education Closet
West Side Shifts
Combine math, language arts, music, and dance with an activity focused on "America" from West Side Story. After listening to the song, learners compare the film to Romeo and Juliet, analyze the song's meter, design choreography, plan...
CCSS Math Activities
Cereal
Your breakfast cereal is a good source of math practice. Young mathematicians apply ratios and percents to analyze the amount of protein and carbohydrates in two brands of cereal. They complete a worksheet to answer several questions on...
CCSS Math Activities
Gym
Math requires strength training, too. Scholars consider three different pricing systems for a gym. Given several scenarios, they determine which gym would be cheaper and find how many visits it takes for the costs to be equal.
CCSS Math Activities
Baseball Players
Statistics is an important part of baseball. Given the mean weight of players on a baseball team, scholars determine the total weight of the players. They then find the median and range of weights for the opposing team. Lastly, they...


