Curated OER
Getting it Right! An Investigation of the Pythagorean Theorem
In order to learn about the Pythagorean Theorem, young mathematicians investigate relations and patterns between different sides of a right triangle to look for possible relations among the squared sides. Once they have established the...
Saxon
Plotting Functions
Youngsters use a graphing calculator to assist in creating a function table. They graph the function on a coordinate plane. They explore the relationship between the domain and range in the graph. This four-page worksheet contains two...
Curated OER
Finding Equivalent Forms For Positive Rational Numbers
Learners discuss the relationship between and the equivalent forms of rational numbers. They will convert numbers from decimals to fractions, understanding they are equivalent, but just different forms.
Utah Education Network (UEN)
Linear Graphs Using Proportions and Rates
Using a TI-73 or other similar graphing calculator middle school math majors investigate the linear relationship of equivalent proportions. After a brief introduction by the teacher, class members participate in a timed pair share...
Curated OER
Filling Up-Gasoline
In this fuel sources worksheet, students calculate the E85 alternative fuel costs per gallon compared to the cost of gasoline. Students complete a table to show the comparison prices. They create a triple line graph to show the...
Curated OER
Stretching the Quads
Explore parabolas in this algebra lesson with the graphing calculator. The class investigates what effects the changing of the parameters of the vertex form of a quadrati have to its graph. They find the zeros of a quadratic graphically...
Curated OER
Measure for Measure
Young mathematicians work to recognize the relationship between their scale models of the Joides research vessel and the real vessel. They calculate the relationships between various parts of the ship using fractions, ratios, and...
Curated OER
Barbie Bungee
Middle and high schoolers collect and analyze their data. In this statistics lesson, pupils analyze graphs for linear regression as they discuss the relationship of the function to the number of rubber bands and the distance of the...
Illustrative Mathematics
Crude Oil and Gas Mileage
Here is an activity that presents a real-world problem about the relationship between crude oil production and the gas mileage of modern automobiles. After learners write functions to describe the relationships, they are asked to find...
Mathematics Assessment Project
Representing Polynomials
Use this complete and very detailed lesson plan to assess your students' understanding of two important behaviors of polynomials. The first is the relationship between the zeros of a polynomial function and the function's graph, and the...
Agile Mind
Transforming Graphs of Quadratic Functions
In the activity on this webpage, learners use interactive graphing technology to investigate transformations of graphs. In the first part of the task, they look at the graph of a quadratic function with coordinates of a few points...
Illustrative Mathematics
Kimi and Jordan
Kimi and Jordan have taken summer jobs to supplement their weekly allowances. Kimi earns more per hour than Jordan, but Jordan's weekly allowance is greater. This activity asks students to determine how the incomes of the two workers...
Illustrative Mathematics
Exponentials and Logarithms II
Learners are given a logarithmic function and its inverse exponential function. The task, which is to graph both compositions of the two functions, uses the inverse nature of exponents and logarithms to generalize about the properties of...
Illustrative Mathematics
Average Cost
Here is an activity that presents a good example of a function modeling a relationship between two quantities. John is making DVDs of his friend's favorite shows and needs to know how much to charge his friend to cover the cost of making...
Curated OER
Rounding and Subtracting
Common Core is all about getting your learners to open their minds and think about the why and how. This problem has them thinking about unknown numbers and their relationship with one another when we round and subtract. They will have...
Charleston School District
Tables of Linear Functions
Don't forget the tables! The previous lessons in this five-part series examined the linear equation and graph relationship. The current lesson adds tables to the mix. At completion, individuals should be able to create a table of values,...
Charleston School District
Converting Fractions and Decimals
A decimal is just a fraction in disguise! Scholars learn methods for converting decimals and fractions including repeating decimals. Performing the conversions strengthens their understanding of the relationship between the two forms....
Charleston School District
The Line of Best Fit
If it's warm, they will come! Learners find a line of best fit to show a relationship between temperature and beach visitors. Previous lessons in the series showed pupils how to create and find associations in scatter plots. Now, they...
Mathematics Assessment Project
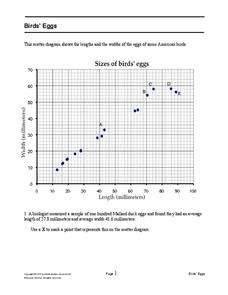
Bird’s Eggs
Are the length and width of birds' eggs related? Young ornathologists use a scatter plot to investigate the relationship between the length and width of eggs for Mallard ducks. They then determine the egg with the greatest...
Inside Mathematics
Squares and Circles
It's all about lines when going around. Pupils graph the relationship between the length of a side of a square and its perimeter. Class members explain the origin in context of the side length and perimeter. They compare the graph to the...
Education Development Center
Area Model Factoring
Introduce learners to what factoring represents and it's relationship to a square with a resource about factoring and the method of area models. The questions are scaffolded to begin with introductory questions and eventually have...
EngageNY
Fundamental Theorem of Similarity (FTS)
How do dilated line segments relate? Lead the class in an activity to determine the relationship between line segments and their dilated images. In the fourth section in a unit of 16, pupils discover the dilated line segments are...
EngageNY
Informally Fitting a Line
Discover how trend lines can be useful in understanding relationships between variables with a lesson that covers how to informally fit a trend line to model a relationship given in a scatter plot. Scholars use the trend line to make...
EngageNY
The Line Joining Two Distinct Points of the Graph y=mx+b Has Slope m
Investigate the relationship between the slope-intercept form and the slope of the graph. The lesson plan leads an investigation of the slope-intercept equation of a line and its slope. Pupils realize the slope is the same as the...
Other popular searches
- Healthy Relationships
- Relationships
- Interpersonal Relationships
- Linear Relationships
- Exponential Relationship
- Quadratic Relationships
- Ecological Relationships
- Family Relationships
- Symbiotic Relationships
- Inverse Relationship
- Angle Relationships
- Letter Sound Relationship


