Mathematics Assessment Project
Circles in Triangles
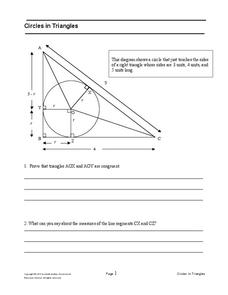
Circles, and triangles, and tangents, oh my! In the assessment task, learners first answer questions leading to the radius of an inscribed circle for a given right triangle. They then use the result to independently determine the radius...
Mathematics Assessment Project
Functions
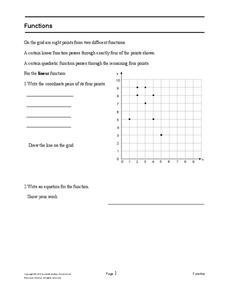
After identifying which of the given coordinate points fall on the graph of a line and which fall on the graph of a parabola, pupils write equations for each function.
Math Drills
Translations (2)
Do the two-step and use coordinates to move your graph side to side with translations. By using the coordinates as the guide for the shifts, learners graph straight on the worksheet and compare their answers with the key.
Charleston School District
Sketching a Piecewise Function
How do you combine linear and nonlinear functions? You piece them together! The lesson begins by analyzing given linear piecewise functions and then introduces nonlinear parts. Then the process is reversed to create graphs from given...
EngageNY
The Distance from a Point to a Line
What is the fastest way to get from point A to line l? A straight perpendicular line! Learners use what they have learned in the previous lessons in this series and develop a formula for finding the shortest distance from a point to a...
EngageNY
Equations for Lines Using Normal Segments
Describing a line using an algebraic equation is an essential skill in mathematics. The previous instructional activity in the series challenged learners to determine if segments are perpendicular with a formula. Now they use the formula...
EngageNY
Criterion for Perpendicularity
The Pythagorean Theorem is a geometry pupil's best friend! Learners explain the equation a1b1 + a2b2 = 0 for perpendicular segments using the Pythagorean Theorem. They are able to identify perpendicular segments using their endpoints and...
EngageNY
Designing a Search Robot to Find a Beacon
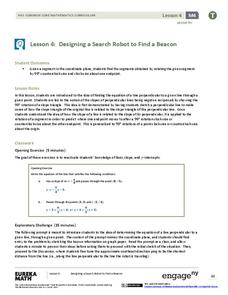
Build right angles using coordinate geometry! Pupils explore the concept of slope related to perpendicular lines by examining 90-degree rotations of right triangles. Learners determine the slope of the hypotenuse becomes the opposite...
Charleston School District
Analyzing Scatter Plots
Scatter plots tell a story about the data — you just need to be able to read it! Building from the previous lesson in the series where learners created scatter plots, they now learn how to find associations in those scatter plots. They...
Charleston School District
Review Unit 6: Systems of Equations
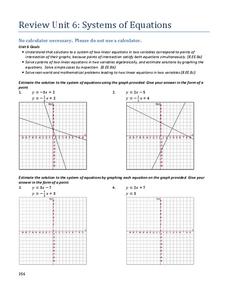
It's time to show off what they learned! The final lesson in the series is a review worksheet on the topics learned throughout the unit. Scholars solve systems of equations using graphic and algebraic methods, solve system-based word...
Charleston School District
Solving Systems Graphically
When guess and check gets old, it's time to start graphing! An instructive lesson explains how to solve a system of linear equations using graphing. Equations are in both slope-intercepts and standard form.
Charleston School District
Pre-Test Unit 6: Systems
As if solving equations with an x isn't tricky enough, now they add a y, too? A pre-assessment gauges the knowledge of your classes related to systems. They are asked to solve graphically and algebraically and to solve word problems.
Charleston School District
Constructing Scatter Plots
Having more letters in your name helps you get a better grade in your math class—or does it? Learners create scatter plots to organize data. The lesson places emphasis on determining scale and intervals and labeling axis.
Charleston School District
The Distance Between Points
Find the shortest distance from A to B using the Pythagorean Theorem! Scholars learn they can find the distance between two points by creating a right triangle using the horizontal and vertical lengths and applying the Pythagorean Theorem.
Charleston School District
Graphing with Slope-Intercept Form
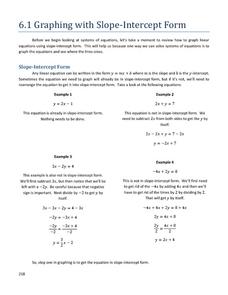
Work on graphing linear equations using the provided materials. The print and video lesson thoroughly review the concepts related to graphing linear equations in slope-intercept and standard form. The materials prepare learners for the...
University of California
Hot! Hot! Hot!
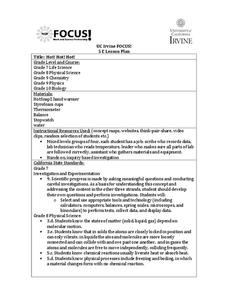
Calories are not tiny creatures that sew your clothes tighter every night, but what are they? A science instructional activity, presented at multiple levels, has learners experiment with heat, heat transfer, and graph the function over...
West Contra Costa Unified School District
Discovering Slope of a Line in Standard Form
From start to finish this skills practice resource provides a way for individuals to explore the standard form equation of a line. Begin with a warm-up, work through the problems, and then discover the relationship between the equation...
Washingtonville Central School District
Systems of Equations (Substitutes and Elimination)
With a whopping total of 66 questions, here is a resource that provides a full variety of systems of equations questions using elimination and substitution solution methods.
Kuta Software
Equations in Standard Form - Solving Systems by Graphing
Get to graphing and figure out the solution between two lines using this 14-problem worksheet. Graphs are provided for the first eight problems, but requires learners to graph the remaining six separately.
Firelands Local Schools
Exponential Growth and Decay
How can you safely model exponential growth and decay? A hands-on activity uses candies to model not only exponential decay, but also exponential growth. Exponential equations are fitted by hand and by use of a calculator to the data...
Stats Monkey
Everything I Ever Needed to Learn about AP Statistics I Learned from a Bag of M and M's®
Candy is always a good motivator! Use this collection of M&M's® experiments to introduce statistics topics, including mean, standard deviation, nonlinear transformation, and many more. The use of a hands-on model with these AP...
West Contra Costa Unified School District
Connecting Graphing and Solving Absolute Value Equations and Functions
Can you solve an equation graphically? Absolutely! This Algebra II lesson makes the connection between solving an absolute value equation and graphing two functions. Graphing absolute value functions is presented through the process of...
West Contra Costa Unified School District
Graphing Systems
Get hands on with solving systems of equations graphically. A solid lesson plan uses guided practice to show how to solve systems of linear equations. It allows time for sharing ideas and provides a printable matching activity to promote...
West Contra Costa Unified School District
Comparing Rational Functions and Simplified Functions
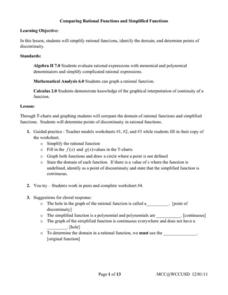
What kind of functions have holes in their graphs? Here, the teacher guides the class on how to use the simplified function of a rational function to aid in the graphing of the original rational function. T-tables are used in order to...


