EngageNY
Relationships Between Quantities and Reasoning with Equations and Their Graphs
Graphing all kinds of situations in one and two variables is the focus of this detailed unit of daily lessons, teaching notes, and assessments. Learners start with piece-wise functions and work their way through setting up and solving...
Curated OER
Graphing Stories Ice Breaker
Kick off the school year with some math fun! New classmates share information about themselves by using graphs and interpreting data. The goal is to use a general graph shape, such as linear or exponential, and create labels for the axes...
EngageNY
Modeling with Inverse Trigonometric Functions 2
Use inverse trigonometric functions to work with ramps, rabbits, and Talladega. The class models real-world situations with trigonometric functions and solves them using inverses in the 15th installment of a 16-part series. Pupils solve...
Mt. San Antonio Collage
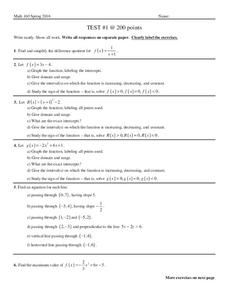
Test 1: Functions and Their Graphs
Save the time creating an assessment because these function problems should do the trick. With 10 multi-part questions, they each focus on a different topic including radical, polynomial, linear and piecewise functions. The majority of...
North Carolina State University
Exploring Genetics Across the Middle School Science and Math Curricula
Where is a geneticist's favorite place to swim? A gene pool. Young geneticists complete hands-on activities, experiments, and real-world problem solving throughout the unit. With extra focus on dominant and recessive genes, Punnett...
EngageNY
Mathematical Area Problems
Teach the connection between area models and the distributive property through problem-solving. The 22nd activity in a series of 29 explains the distributive property graphically. Learners build area models from word problems and convert...
BW Walch
Solving Linear Inequalities in Two Variables
Although graphing a linear inequality on the plane is but a few steps added onto the graphing of a linear equation, for many learners the logical leap is quite intimidating. This approachable PowerPoint presentation breaks graphing...
BW Walch
Solving Systems of Linear Equations
Solving systems of equations underpins much of advanced algebra, especially linear algebra. Developing an intuition for the kinds and descriptions of solutions is key for success in those later courses. This intuition is exactly what...
EngageNY
Graphs Can Solve Equations Too
There are many equations Algebra I students are not ready to solve. Graphing to solve gives them a strategy to use when they are unsure of an algebraic approach to solve the problem. The lesson exposes learners to a wide variety of...
EngageNY
Tax, Commissions, Fees, and Other Real-World Percent Problems
Pupils work several real-world problems that use percents in the 11th portion of a 20-part series. The problems contain percents involved with taxes, commissions, discounts, tips, fees, and interest. Scholars use the equations formed for...
EngageNY
Graphing Solutions to Inequalities
Activate the strengths of your visual learners using an informative instructional activity. In the 15th installment of the series of 28, pupils graph their solutions on number lines to create a visual representation of solutions....
Missouri Department of Elementary
Dealing with Peer Influence: What Are Bullying and Harassment?
Scholars examine examples of peer pressure and discuss how specific actions negatively affect one's well-being. Learners gather in small groups to write two scenarios in which peer pressure is used. They reference the STAR method in how...
EduGAINs
Solving Linear Equations
To find x, you have to get it by itself, correct? Individuals solve a linear word problem and share their solutions with others that solved the problem in a similar fashion. They then complete a self-assessment on how they feel about...
West Contra Costa Unified School District
Solving a System by Substitution
Solving systems by substitution can be a challenging topic in algebra I. Here is a lesson that builds on students' understanding of intercepts to begin the process of substitution, and all work is reinforced graphically to build...
EngageNY
Markup and Markdown Problems
There is a 100 percent chance this resource will help pupils connect percents to financial literacy. Young mathematicians use their knowledge of percents to find markups and markdowns in financial situations in the seventh segment in a...
Mathematics Assessment Project
Representing Quadratic Functions Graphically
Sometimes being different is an advantage. An engaging activity has scholars match cards with quadratic functions in various forms. Along the way, they learn about how each form highlights key features of quadratic functions.
Mt. San Antonio Collage
Test 1: Graphing Functions
Graph the night away with all the different types of functions provided in the worksheet. Linear, quadratic, and rational all ask for graphs, domain and range and other key factors about the functions.
West Contra Costa Unified School District
Point-Slope Application Problems
Create a linear equation for a problem when the intercept information is not given. The two-day lesson introduces the class to the point-slope form, which can be used for problems when the initial conditions are not provided. Pupils...
EduGAINs
Introduction to Solving Linear Systems
Word problems offer class members an opportunity to learn the concept of solving linear systems using graphs. Individuals choose a problem based upon preferences, break into groups to discuss solution methods and whether there...
Code.org
Algorithms Detour - Shortest Path
Young programmers investigate the Single Source Shortest Path problem by working in paris to devise their own algorithm. They then progress to using Dijkstra's Algorithm to solve the problem.
Baylor College
Living Things and Their Needs: The Math Link
Enrich your study of living things with these cross-curricular math activities. Following along with the story Tillena Lou's Day in the Sun, learners will practice addition and subtraction, learn how to measure volume and length,...
Curated OER
Usage and Interpretation of Graphs
Cooperative groups are formed for this graphing activity. Each group must construct a graph that represents how many eyelets (the holes for laces in shoes), are present in their group. A whole-class bar graph is eventually constructed...
Curated OER
Hand Span and Height
Is there a relationship between hand span width and height? Statisticians survey each other by taking measurements of both. A table that can hold data for 24 individuals is printed onto the worksheet, along with questions for analysis....
Del Mar College
Intermediate Algebra Assessment Review
Put on your Algebra cap because this review provides practice on topics such as linear equations, rational expressions, and function problems. All the questions are multiple choice, and while the focus is on a few main sections,...


