Curated OER
Feature column: Hands on Math With Technology
Young learners will view a math adventures video and practice math concepts. Afterwards they will navigate through Internet sites to participate in teacher selected math adventures. This guide walks you through integrating...
EngageNY
Modeling Riverbeds with Polynomials (part 2)
Examine the power of technology while modeling with polynomial functions. Using the website wolfram alpha, learners develop a polynomial function to model the shape of a riverbed. Ultimately, they determine the flow rate through the river.
CK-12 Foundation
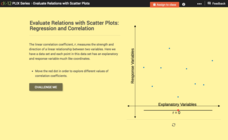
Evaluate Relations with Scatter Plots: Regression and Correlation
Introduce the concept of a correlation coefficient using an interactive lesson. Learners begin by manipulating a correlation coefficient and watching a graph change to represent the new value. Questions help strengthen their...
EngageNY
Comparison of Numbers Written in Scientific Notation and Interpreting Scientific Notation Using Technology
Examine numbers in scientific notation as a comparison of size. The 14th lesson in the series asks learners to rewrite numbers as the same power of 10 in scientific notation to make comparisons. Pupils also learn how to use a calculator...
Curated OER
My Foot and the Standard Foot
Young mathematicians put one foot in front of the other as they learn how to measure length in an elementary math lesson. Using paper cutouts of their own feet, children measure classroom objects as they discover the importance of...
Intel
Choreographing Math
Leaners investigate families of linear functions through dance. They choreograph dance moves to model nine unique linear functions of their choosing. Using their dance moves, teams create a video presentation complete with music and...
Mascil Project
Packaging
Wrap up an engineering lesson with a worthwhile project. An engineering design task challenges groups to develop a package for a pharmaceutical company given constraints on the volume. Learners then create a presentation to highlight...
Curated OER
Solar Kit Lesson # 12 - Calibration Curve for a Radiation Meter
Scientists need to have mastered algebraic slope-intercept concepts in order for this lesson to be effective. They will measure and graph solar panel output as a function of the amount of radiation striking it, discovering that there is...
Texas Instruments
TI-Nspire™
We landed on the moon with less computing capabilities than you can find in this app! Here is a multiple function calculator that takes all the power you get from a handheld and adds the wonderful large screen that only a tablet can...
Mathematics Vision Project
Module 2: Logarithmic Functions
You can't build a fire with these logs! Filled with hands-on investigations, a complete logarithmic unit offers both instruction and practice. Learners first build an understanding of the new function, then explore properties before...
Science 4 Inquiry
Musical Vibes with Palm Pipes
Ancient people used musical pipes as early as the third millennium BCE. Young scientists explore the workings of musical pipes to better understand the relationship with frequency, length of pipe, and sound waves. They determine the...
Kenan Fellows
Reading Airline Maintenance Graphs
Airline mechanics must be precise, or the consequences could be deadly. Their target ranges alter with changes in temperature and pressure. When preparing an airplane for flight, you must read a maintenance graph. The second lesson of...
Curated OER
Get in Shape with Geometry
Using geoboards, computer programs, and hands-on manipulative materials, elementary schoolers engage in a study of two and three-dimensional geometric shapes. This instructional activity is chock full of good teaching ideas on the...
Curated OER
Data Displays with Excel
Students collect and analyze data. In this statistics lesson, students display their data using excel. They plot the data on a coordinate plane and draw conclusion from their data.
Curated OER
What's Your Shoe Size? Linear Regression with MS Excel
Learners collect and analyze data. In this statistics lesson, pupils create a liner model of their data and analyze it using central tendencies. They find the linear regression using a spreadsheet.
CK-12 Foundation
Direct Variation: Value of a Painting
Help your pupils find a pattern of direct variation. Young scholars use input-output pairs to find a constant of variation and then write the equation. As they build their equations, the interactive lesson provides feedback.
02 x 02 Worksheets
Inverse Variation
Discover an inverse variation pattern. A simple lesson plan design allows learners to explore a nonlinear pattern. Scholars analyze a distance, speed, and time relationship through tables and graphs. Eventually, they write an equation to...
North Carolina State University
Construction
Engineering design projects serve as great opportunities for collaborative problem solving. For this case, students work in small groups designing, building, and eventually testing a structure that meets a teacher-specified objective. It...
Curated OER
Exploring Transformations with Matrices
A page right out of the Holt Geometry book. Use a graphing calculator and graph paper to explore transformations with matrices.
Curated OER
Using Technology to Represent Mathematical Identities
Students explore the concept of trig identities. In this trig identity lesson, students use Mathematica to graph trig identities. Students see the trig identities graphically and enforce the notion that two trig functions can be equivalent.
Curated OER
American Indian Flute and Math
Students investigate the Math behind Musical instruments in this cross-curricular Math activity on the Native American Flute and waveforms. The activity can be accomplished in 6 days and includes an extensive materials list for...
Kenan Fellows
Designing and Analyzing Data Collected from Wearable Devices to Solve Problems in Health Care
Wearable devices have become more the norm than the exception. Learners analyze data from a sample device with a regression analysis in a helpful hands-on lesson. Their focus is to determine if there is a connection between temperature...
Statistics Education Web
Saga of Survival (Using Data about Donner Party to Illustrate Descriptive Statistics)
What did gender have to do with the survival rates of the Donner Party? Using comparative box plots, classes compare the ages of the survivors and nonsurvivors. Using the same method, individuals make conclusions about the...
Project Maths
Integral Calculus
From derivatives to antiderivatives and back again. Building on the second lesson of the three-part series covering functions, learners explore the concept of an antiderivative. They connect the concept to the graph of the function and...
