National Security Agency
Line Plots: Frogs in Flight
Have a hopping good time teaching your class how to collect and graph data with this fun activity-based lesson series. Using the provided data taken from a frog jumping contest, children first work together...
Virginia Department of Education
Scatterplots
Math is all fun and games with this activity! Learners use an activity designed around hula hoops to collect data. They create scatter plots with their data and then analyze the graphs for correlation.
Core Knowledge Foundation
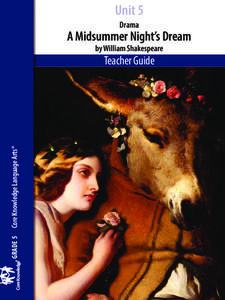
Unit 5: A Midsummer Night’s Dream
Fifth graders analyze William Shakespeare's A Midsummer Night's Dream, paying close attention to character development, plot, and dialogue. With daily reading and thoughtful discussion, scholars take pen to paper to respond to journal...
Virginia English Bulletin
Book Trailer Projects From Classroom to Community
Invite your pupils to express their understanding of a novel through a collaborative video project. Groups choose a novel from those you have studied in class, select four scenes, storyboard the scenes, film the scenes, edit the film,...
Curated OER
Flicking Football Fun
Young mathematicians fold and flick their way to a deeper understanding of statistics with a fun, hands-on math unit. Over the course of four lessons, students use paper footballs to generate data as they learn how to create line...
Curated OER
Button Bonanza
Collections of data represented in stem and leaf plots are organized by young statisticians as they embark some math engaging activities.
Statistics Education Web
Text Messaging is Time Consuming! What Gives?
The more you text, the less you study. Have classes test this hypothesis or another question related to text messages. Using real data, learners use technology to create a scatter plot and calculate a regression line. They create a dot...
Radford University
Sleep and Teen Obesity: Is there a Correlation?
Does the number of calories you eat affect the total time you sleep? Young mathematicians tackle this question by collecting their own data and making comparisons between others in the class through building scatter plots and regression...
Kenan Fellows
Saving Those Who Save Us: Exploring the Use of Sensors with Data Visualization
Sensor technology is amazingly accurate and useful. Combining the sensor technology and mathematical knowledge, scholars design experiments to answer a question they have developed. Questions may focus on light sensing, temperature...
Teach Engineering
Understanding the Air through Data Analysis
Is there a correlation or causation relationship between air pollutants? Groups develop a hypothesis about the daily variation of air pollutants, specifically ozone and CO2. Using Excel to analyze the data, the groups evaluate their...
Radford University
Box-and-Whisker Activity
Think inside the box. Working in small groups, pupils design a study to answer comparing two data sets. Team members collect data and construct box-and-whisker plots and analyze them to prove or disprove their hypothesis. They develop...
Consortium for Ocean Leadership
Nannofossils Reveal Seafloor Spreading Truth
Spread the word about seafloor spreading! Junior geologists prove Albert Wegener right in an activity that combines data analysis and deep ocean exploration. Learners analyze and graph fossil sample data taken from sites along the...
American Statistical Association
What is the Probability of “Pigging Out”
Learners apply their understanding of luck to a probability experiment. They play a game of Pass the Pigs to determine the probability of a specific outcome. Using analysis for their data, pupils declare the measures of center, dot...
Radford University
A Change in the Weather
Explore the power of mathematics through this two-week statistics unit. Pupils learn about several climate-related issues and complete surveys that communicate their perceptions. They graph both univariate and bivariate data and use...
American Statistical Association
Armspans
Young mathematicians collect data on the arm spans of classmates. Then they sort the data by measures of center, spread, and standard deviation. Finally, they compare groups, such as boys and girls, to interpret any differences.
Friends of Fort McHenry
British Attacks in the Chesapeake during the War of 1812
This is a fun mapping activity that will have your class knowing the ins and outs of the battles in the War of 1812. Your young cartographers will not only plot decisive attacks, but will analyze their purpose, goals, and impact on...
Beyond Benign
Got Gas
How much gas does it take to drive around town? The class uses a variety of mathematical procedures to take a look at the use of gas for transportation. Class members use a different unit to determine the cost of driving a car as opposed...
Math by Design
Transformations – Reflections
Scholars use interactive resources to figure out how to mathematically draw a reflection of a geometric shape viewed in a mirror. To conclude the activity, class members are asked to deduce the result of multiple reflections across...
Statistics Education Web
Population Parameter with M-and-M's
Manufacturers' claims may or may not be accurate, so proceed with caution. Here pupils use statistics to investigate the M&M's company's claim about the percentage of each color of candy in their packaging. Through the activity,...
National Endowment for the Humanities
A Wrinkle in Time: The Board Game
Tackle some big questions about A Wrinkle in Time by Madeleine L'Engle with a board game project. As learners brainstorm for and complete their board games, they consider what helps and hinders Meg on her journey and why she succeeds in...
NOAA
The Oceanographic Yo-yo
How does chemistry help deep-sea explorers? Part four of a five-part series of lessons from aboard the Okeanos Explorer introduces middle school scientists to technologies used in ocean exploration. Groups work together to analyze data...
Discovery Education
Sonar & Echolocation
A well-designed, comprehensive, and attractive slide show supports direct instruction on how sonar and echolocation work. Contained within the slides are links to interactive websites and instructions for using apps on a mobile device to...
Dr. Seuss Enterprises
Dr. Seuss in the Classroom
Explore the works of Dr. Seuss, such as Horton Hears a Who, Horton Hatches and Egg, The Sneetches and Other Stories, The Lorax, The Butter Battle Book, and Yertle the Turtle and Other Stories. Each story lesson includes reading...
Science 4 Inquiry
Edible Plate Tectonics
Many people think they can't observe plate tectonics, but thanks to GPS, we know that Australia moves at a rate of 2.7 inches per year, North America at 1 inches per year, and the Pacific plate at more than 3 inches per year! Scholars...


