Baylor College
Living Things and Their Needs: The Math Link
Enrich your study of living things with these cross-curricular math activities. Following along with the story Tillena Lou's Day in the Sun, learners will practice addition and subtraction, learn how to measure volume and length,...
Shodor Education Foundation
Graph Sketcher
Sketch graphs with the Graph Sketcher. Scholars graph functions on a coordinate plane. An interactive makes it as easy as inputting the function and clicking a button.
Illustrative Mathematics
Weather Graph Data
Teaching young mathematicians about collecting and analyzing data allows for a variety of fun and engaging activities. Here, children observe the weather every day for a month, recording their observations in the form of a bar graph....
Shodor Education Foundation
Graphit
No graphing calculator? No worries, there's an app for that! Young mathematicians use an app to graph functions. In addition, they can also plot data points.
Shodor Education Foundation
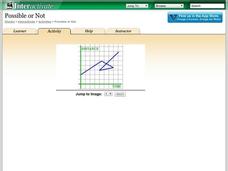
Possible or Not?
What does the graph mean? Pupils view 10 graphs and determine whether they are possible based on their contexts. The contexts are distance versus time and profit versus time.
Shodor Education Foundation
Conic Flyer
Graphing conics made easy. Individuals use an interactive to graph conic sections. The app can handle circles, vertical and horizontal parabolas, ellipses, and vertical and horizontal hyperbolas.
Shodor Education Foundation
Plop It!
Build upon and stack up data to get the complete picture. Using the applet, pupils build bar graphs. As the bar graph builds, the interactive graphically displays the mean, median, and mode. Learners finish by exploring the changes in...
Shodor Education Foundation
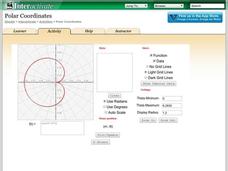
Polar Coordinates
Polar opposites might not work together—but polar coordinates do! The interactive provides learners the opportunity to graph trigonometric and algebraic functions using polar coordinates. The program takes either individual data points...
Shodor Education Foundation
Data Flyer
Fit functions to data by using an interactive app. Individuals plot a scatter plot and then fit lines of best fit and regression curves to the data. The use of an app gives learners the opportunity to try out different functions to see...
Illustrative Mathematics
Hours of Daylight 1
The midline of the mathematical model of the number of hours of sunlight is not 12 hours. Pupils use the modeling cycle to determine a function that will model the number of hours of sunlight at a location of their choosing. Using...
Shodor Education Foundation
Sequencer
Take the first step into graphing sequences. Learners set the starting number, multiplier, add-on, and the number of steps for a sequence. Using the inputs, the interactive calculates and plots the sequence on the coordinate plane. Users...
Shodor Education Foundation
Scatter Plot
What is the relationship between two variables? Groups work together to gather data on arm spans and height. Using the interactive, learners plot the bivariate data, labeling the axes and the graph. The resource allows scholars to create...
Shodor Education Foundation
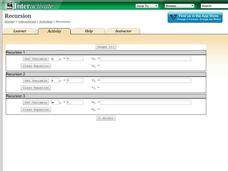
Recursion
Perform the operation ... and then do it again. Scholars investigate recursive formulas by creating and graphing them. Using the interactive, pupils set the variable, determine the initial value, and type in a recursive formula.The...
Shodor Education Foundation
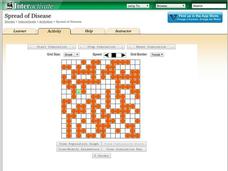
Spread of Disease
Control the spread of a contagious disease. An applet allows pupils to run a simulation on the spread of a disease. Rules govern how the disease is spread and the length of time it takes to recover. Learners view the spread visually and...
Shodor Education Foundation
Vertical Line Test
Connect the points to create a function. Using points given by the applet, pupils try to connect them to create a line that would pass the vertical line test. The resource keeps track of the number of sets the learner is able to identify...
Shodor Education Foundation
Two Variable Function Pump
Use a function to operate on two variables. Pupils look at operating with complex numbers as a function of two variables. The interactive squares the input and adds a constant to it. Learners visualize the resulting output and its...
Mathematics Vision Project
Module 1: Functions and Their Inverses
Undo a function to create a new one. The inverse of a function does just that. An inquiry-based lesson examines the result of reversing the variables of a function, beginning with linear patterns and advancing to quadratic and...
Shodor Education Foundation
Box Plot
What information can come from a box? Learners choose a data set to display as a box plot and decide whether to include the median in the calculation of the quartiles, show the outliers, and change the scale. To finish the lesson,...
Shodor Education Foundation
Regression
How good is the fit? Using an interactive, classmates create a scatter plot of bivariate data and fit their own lines of best fit. The applet allows pupils to display the regression line along with the correlation coefficient. As a final...
Shodor Education Foundation
Skew Distribution
Slide the class into a skewed view. Learners alter the location of the median relative to the mean of a normal curve to create a skew distribution. They compare the curve to a histogram distribution with the same skewness.
Spectrum
Grade 5 Standardized Test Prep
Here you'll find a great sampling of practice standardized test questions organized into four sections: ELA, mathematics, social studies, and science. Help your learners become familiar with the types of multiple-choice questions...


