Illustrative Mathematics
Offensive Linemen
Comparing college football teams, Division I is said to have heavier lineman than Division III. Your mathematicians are given data from two different divisions and will have to interpret a dotplot and calculate the difference in weight...
Illustrative Mathematics
Sand Under the Swing Set
Help the local elementary school fix their playground by calculating the amount of sand needed near the swing set. The problem practices setting up proportions and ratios with three different options for solving. You can chose the option...
Math Drills
Volume and Surface Area of Rectangular Prisms
Your learners get solid practice calculating the surface area and volume of rectangular prisms with this instructional activity. There are ten versions of the activity for their enjoyment, and yours.
Curated OER
Transformations in the Coordinate Plane
Your learners connect the new concepts of transformations in the coordinate plane to their previous knowledge using the solid vocabulary development in this unit. Like a foreign language, mathematics has its own set of vocabulary terms...
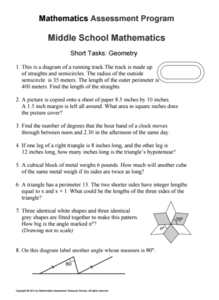
Mathematics Assessment Project
Geometry
Help learners find joy in facing mathematical challenges. The questions posed on this worksheet encourage young mathematicians to utilize skills learned throughout a geometry unit, and to apply themselves and persevere through problem...
Willow Tree
Transformations
How does something go from here to there? Describe it with a transformation. Young mathematicians learn how to translate, reflect, rotate, and dilate an image.
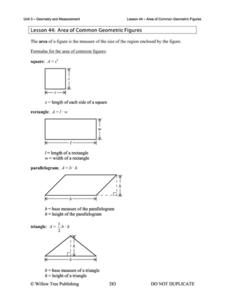
Willow Tree
Area of Common Geometric Figures
Scholars can use area formulas, but can they apply what they know about area? The lesson challenges learners to think logically while practicing finding area of shapes such as rectangles, circles, parallelograms, triangles, and other...
Willow Tree
Surface Area of Three-Dimensional Figures
Lateral area and surface area are simple concepts, but calculating them is not as easy! Using formulas, learners calculate lateral area and surface area for the same three-dimensional figures. The resource discusses the formula variables...
Willow Tree
Histograms and Venn Diagrams
There are many different options for graphing data, which can be overwhelming even for experienced mathematcians. This time, the focus is on histograms and Venn diagrams that highlight the frequency of a range of data and overlap of...
Mathematics Assessment Project
Glasses
Clink, clink! Young mathematicians investigate drinking glasses composed of known solids (cones, cylinders, and hemispheres). Next, they determine the volumes of these glasses.
Mathematics Assessment Project
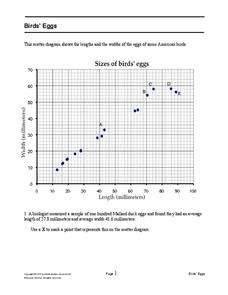
Bird’s Eggs
Are the length and width of birds' eggs related? Young ornathologists use a scatter plot to investigate the relationship between the length and width of eggs for Mallard ducks. They then determine the egg with the greatest...
EngageNY
Estimating Probability Distributions Empirically 2
Develop probability distributions from simulations. Young mathematicians use simulations to collect data. They use the data to draw graphs of probability distributions for the random variable in question.
Balanced Assessment
Fit-Ness
Serve four towns with one bus route. Pupils develop a bus route that meets certain criteria to serve four towns. They determine which of the routes would best serve all of them. Individuals then hypothesize where a fifth town should be...
Balanced Assessment
Stock Market
Analyze trends in the stock market using histograms. Future economists use data presented in a histogram to find periods of greatest increase and decrease. They also draw conclusions about days that would be best to invest.
Mathed Up!
Solving Quadratics by Factorising
Young mathematicians view a video on solving quadratic equations by factoring. They use this skill to complete a worksheet of practice problems — a great way to gauge understanding!
California Education Partners
Miguel's Milkshakes
Moooove over, there's a better deal over there! The fourth segment in a series of eight requires individuals to determine the best unit cost for milk. Scholars calculate the least amount they can spend on a particular quantity of milk....
Concord Consortium
Catching Up
Class members have some catching up to do. Given a linear equation describing the distance of a runner, young mathematicians interpret the equation in terms of the context. They consider a general equation of the same form and describe...
Concord Consortium
Center of Population
Let the resource take center stage in a lesson on population density. Scholars use provided historical data on the center of the US population to see how it shifted over time. They plot the data on a spreadsheet to look the speed of its...
Mathematics Vision Project
Module 8: Probability
It's probably a good idea to use the unit. Young mathematicians learn about conditional probability using Venn diagrams, tree diagrams, and two-way tables. They also take into consideration independence and the addition rules.
Mathematics Vision Project
Module 7: Trigonometric Functions, Equations, and Identities
Show your class that trigonometric functions have characteristics of their own. A resource explores the features of trigonometric functions. Learners then connect those concepts to inverse trigonometric functions and trigonometric...
Concord Consortium
Flying High
Some planes are just more efficient than others. Young mathematicians use data on the number of seats, airborne speed, flight length, fuel consumption, and operating cost for airplanes to analyze their efficiency. They select and use...
Concord Consortium
It's In the Mail
It's time to check the mail! The task is to determine the most cost-effective way to mail a packet of information. Young scholars write an equation that models the amount of postage as a function of the number of sheets mailed and...
Concord Consortium
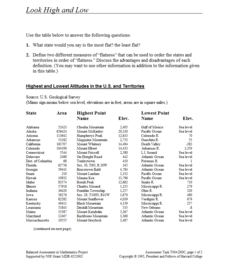
Look High and Low
From the highest high to the lowest low here's a resource that won't fall flat. Given data on the area and the highest and lowest elevations of each of the 50 states, learners decide which states are the least flat and the most flat. Of...
Concord Consortium
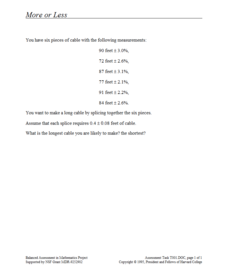
More or Less
How long can the cable get? A short performance task provides learners with information on the length of cables and the margin of error for each. They must determine the longest and shortest cable possible by splicing these cables.
Other popular searches
- Perimeter Math Measurement
- Math Measurement Inches
- Math Measurement Lesson Plans
- Math Measurement Length
- Math Measurement Metric
- Esl Math Measurement
- Math Measurement Worksheets
- Esol Math Measurement
- Math Measurement Lessons
- Liquid Measurement in Math
- Measurement/math Literature
- Angle Measure Math


