Buffalo State
A Five Day Approach to Using Technology and Manipulatives to Explore Area and Perimeter
Young mathematicians build an understanding of area and perimeter with their own two hands in a series of interactive geometry lessons. Through the use of different math manipulatives, children investigate the properties of...
EngageNY
Comparison of Numbers Written in Scientific Notation and Interpreting Scientific Notation Using Technology
Examine numbers in scientific notation as a comparison of size. The 14th lesson plan in the series asks learners to rewrite numbers as the same power of 10 in scientific notation to make comparisons. Pupils also learn how to use a...
Curated OER
Use Google Maps to Teach Math
Capture the engagement of young mathematicians with this upper-elementary math lesson on measuring time and distance. Using Google Maps, students first measure and compare the distance and time it takes to travel between different...
THUP Games
Monkey Math School Sunshine
Hang out at the beach and listen to some relaxing tunes, all while developing basic math skills. An endless source of fun and learning for young children!
One Billion
Math, Age 3-5
Jump start children's math education with this fun basic skills resource. Offering dozens of different touch-and-swipe activities with colorful graphics, this program is perfect for all young learners.
EngageNY
Modeling Riverbeds with Polynomials (part 1)
Many things in life take the shape of a polynomial curve. Learners design a polynomial function to model a riverbed. Using different strategies, they find the flow rate through the river.
Mathematics Vision Project
Module 7: Modeling with Functions
The sky's the limit of what you create when combining functions! The module begins with a review of transformations of parent functions and then moves to combining different function types using addition, subtraction, and...
Virginia Department of Education
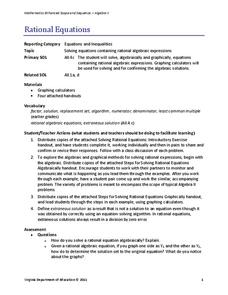
Rational Equations
Provide guidance and practice of the useful skill: solving rational equations using both an algebraic and graphical approach. Pupils solve increasingly more difficult rational equations using algebraic methods. After, they...
Concord Consortium
Here Comes the Sun
Many phenomena in life are periodic in nature. A task-based lesson asks scholars to explore one of these phenomena. They collect data showing the sunrise time of a specific location over the period of a year. Using the data, they create...
Inside Mathematics
Graphs (2007)
Challenge the class to utilize their knowledge of linear and quadratic functions to determine the intersection of the parent quadratic graph and linear proportional graphs. Using the pattern for the solutions, individuals develop a...
Inside Mathematics
Sorting Functions
Graph A goes with equation C, but table B. The short assessment task requires class members to match graphs with their corresponding tables, equations, and verbalized rules. Pupils then provide explanations on the process they used to...
CK-12 Foundation
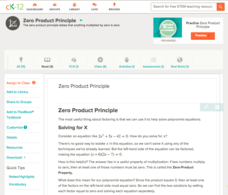
Zero Product Principle
Some lessons feature videos, some interactive practice problems, and some have notes and activities. This comprehensive look at factoring and solving polynomial equations using the zero product principle has all of this and more. Though...
Education World
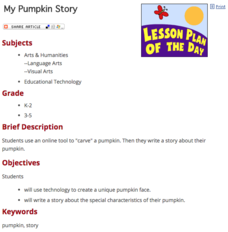
My Pumpkin Story
Have young pumpkin carvers use technology to create a unique pumpkin face and write a short story about the special characteristics of their pumpkin.
Google
Graphing with Google Docs & Forms
Get to know your class and teach about data analysis all with the help of Google Docs. Using student-generated questions, create a class survey using Google Forms. Reserve time in the computer lab for learners to complete the form and,...
EngageNY
Characteristics of Parallel Lines
Systems of parallel lines have no solution. Pupils work examples to discover that lines with the same slope and different y-intercepts are parallel. The 27th segment of 33 uses this discovery to develop a proof, and the class determines...
EngageNY
Modeling Riverbeds with Polynomials (part 2)
Examine the power of technology while modeling with polynomial functions. Using the website wolfram alpha, learners develop a polynomial function to model the shape of a riverbed. Ultimately, they determine the flow rate through the river.
Prince William Network
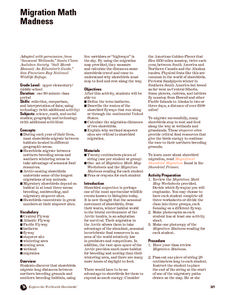
Migration Math Madness
A great way to incorporate math into life science, this lesson plan has learners measure migratory routes on a map and calculate the actual distance that shorebirds on the routes would cover. Learners compute the distance covered in both...
EngageNY
Composition of Linear Transformations 2
Scholars take transformations from the second to the third dimension as they extend their thinking of transformations to include three-dimensional figures. They explore how to use matrices to represent compositions of...
PBS
A Little Recycling Goes A Long Way
Every time you purchase something from the store, it goes into a bag, but what happens to the bag? This lesson encourages your learners to think about what happens to those plastic and paper bags and their effect on the environment. Use...
CK-12 Foundation
Matrix Algebra: Matrix Match
What size is the product of two matrices? Individuals determine that two matrices that can be multiplied and their resulting matrix by connecting them in the interactive resource. They make a generalization about the sizes of...
Rice University
Precalculus
Take a step beyond Algebra 2. Learners use the eBook to learn concepts from the typical Precalculus course. Content starts off with a short review of functions in general and moves on to the basic functions, finishing up with more...
US Department of Commerce
Does the Percentage of People Who Walk to Work in Cities Vary with Population Size?
To walk or not to walk? Pupils create box plots comparing the percentage of residents who walk to work in large, medium, and small cities. Using the box plots, class members compare the data that reflects available statistics. Scholars...
Flipped Math
Modeling with Quadratics
Do some interpretive modeling. Class members watch three examples of interpreting key features of a graph of a quadratic to find solutions to a real-world problem. Learners review how to find the key features on a graph using technology...
Rational Number Project
Initial Fraction Ideas Lesson 9 Overview
Visual models support young mathematicians with exploring equivalent fractions. Starting with a quick warm-up problem, children go on to work through a series of guiding practice problems before working with a partner identifying and...


