Charleston School District
Graphing Functions
How do letters and numbers create a picture? Scholars learn to create input/output tables to graph functions. They graph both linear and nonlinear functions by creating tables and plotting points.
Houston Area Calculus Teachers
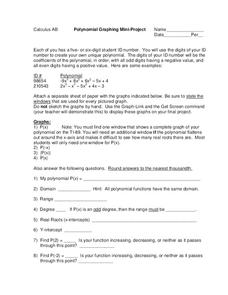
Polynomial Graphing
Your AP Calculus learners probably have their ID numbers memorized, but have they tried graphing them? Pique your pupils' interest by asking each to create a unique polynomial function based on their ID numbers, and then analyze the...
Balanced Assessment
A Run for Two
Develop a graph to represent the distance between two cars. The assessment task presents a scenario in which two cars are traveling at constant speeds with one faster than the other. Pupils develop graphical representations to show the...
Math Drills
Thanksgiving Cartesian Art: Pumpkin
Not a Halloween jack-o-lantern, but a Thanksgiving pumpkin! Young mathematicians graph and connect points on a coordinate system to unveil the mystery picture.
Wise Owl Factory
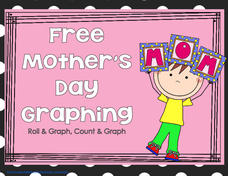
Mother's Day Graphing
A Mother's Day-themed math activity reinforces counting and graphing. Scholars count pictures and roll a festive die then graph their findings using a bar graph.
National Security Agency
Going Green with Graphs
In this unit designed for second graders, youngsters are introduced to conducting surveys and creating tally charts based on the data they gather. Students then construct bar graphs, and observe the relationships between the two...
Baylor College
Air: The Math Link
Inflate this unit on the science of air with these math skills practice and word problems. Accompanying the children's story Mr. Slaptail's Secret, this resource covers a wide range of math topics including the four basic...
Balanced Assessment
Cost of Living
Math scholars investigate the cost of living in Hong Kong compared to Chicago but must first convert the different types of currency. They then choose a type of graph to compare different spending categories and finish the activity by...
Math Drills
Halloween Cartesian Art: Witch Hat
What is the mystery picture? After plotting points on the first quadrant of a Cartesian coordinate system, young mathematicians connect the points to create a Halloween-themed picture.
Math Drills
Thanksgiving Cartesian Art: Pilgrim Hat
What did some Pilgrims wear on top of their heads? Individuals graph sets of ordered pairs, and connect the points to create a mystery Thanksgiving picture.
Math Drills
Thanksgiving Cartesian Art: Mayflower
How did the Pilgrims arrive to America? Middle schoolers graph ordered pairs on a coordinate system, connect the points, and discover a mystery picture—the Mayflower.
Math Worksheets Land
Halloween Cartesian Art: Bat
Get the class batty over graphing. Young mathematicians plot ordered pairs in all quadrants of a Cartesian plane, and connect the points to create a bat.
PreKinders
Fruit Loops Graph
Math can be sweet and delicious! After decorating a picture of a gingerbread house, kids graph how many Fruit Loops® they use by color.
Curated OER
Explore Subtraction
Learnersare given 26 tables and graphs in which they must fill in missing numbers and graph equations. They subtract a given value of x from a constant number, and use a number line to subtract larger numbers from smaller ones resulting...
Concord Consortium
Rational and Not So Rational Functions
Do not cross the line while graphing. Provided with several coordinate axes along with asymptotes, pupils determine two functions that will fit the given restrictions. Scholars then determine other geometrical relationships of asymptotes...
Concord Consortium
Functions by the Slice
Piece by piece ... dismantling a function can highlight interesting patterns. The task asks learners to slice functions in sections with the same vertical change. They then recreate the graph with these slices positioned horizontally....
Balanced Assessment
Writing and Sketching Resource
Picture this—the class creates pictures using functions. Here, learners build functions to model specific graphic criteria. They use their knowledge of parent functions and transformations to create the perfect function.
Balanced Assessment
Postcards from the Falls
Pupils use graphs to analyze two pricing schemes for postcards. After determining which is the best deal, individuals determine what is wrong with the other pricing structures and explain their thinking.
Curated OER
Halloween Point Plot
Practice graphing and plotting points with a festive Halloween flair! Scholars plot 21 points on a grid, connecting them to create a spooky shape!
Willow Tree
Histograms and Venn Diagrams
There are many different options for graphing data, which can be overwhelming even for experienced mathematcians. This time, the focus is on histograms and Venn diagrams that highlight the frequency of a range of data and overlap of...
Wise Owl Factory
Happy Father's Day
Celebrate Father's Day this year with a fun math and coloring activity! After counting all of the dad-related pictures and graphing their frequency, learners color a Father's Day card to give to their dads.
Mathed Up!
Pictograms
Young mathematicians read, interpret, and complete a variety of real-world pictograms. Each question includes a key and information to complete the graphs.
Public Schools of North Carolina
Math Stars: A Problem-Solving Newsletter Grade 3
Make sure your class stays up with the times using this series of math newsletters. Including word problems that cover topics ranging from consumer math and symmetry to graphing and probability, these worksheets are a...
Public Schools of North Carolina
Math Stars: A Problem-Solving Newsletter Grade 2
Develop the problem solving skills of your young learners with this collection of math newsletters. Covering a variety of topics ranging from simple arithmetic and number sense to symmetry and graphing, these...
Other popular searches
- Coordinate Picture Graphs
- Christmas Picture Graphs
- M&m Picture Graphs
- Hidden Picture Math Graphs
- Picture Graphs Worksheets
- Math Lessons Picture Graphs
- 5th Grade Picture Graphs
- Bar and Picture Graphs
- Thanksgiving Picture Graphs
- Circle and Picture Graphs
- Picture Graphs Template
- Reading Picture Graphs


