Mathematics Vision Project
Module 9: Statistics
All disciplines use data! A seven-lesson unit teaches learners the basics of analyzing all types of data. The unit begins with a study of the shape of data displays and the analysis of a normal distribution. Later lessons discuss the...
Mathematics Vision Project
Module 5: Rational Functions and Expressions
Where do those asymptotes come from? Learners graph, simplify, and solve rational functions in the fifth module of a 10-part series. Beginning with graphing, pupils determine the key characteristics of the graphs including an in-depth...
Mathematics Vision Project
Geometric Figures
Logical thinking is at the forefront of this jam-packed lesson, with young mathematicians not only investigating geometric concepts but also how they "know what they know". Through each activity and worksheet, learners wrestle with...
Mathematics Vision Project
Module 7: Modeling with Functions
The sky's the limit of what you create when combining functions! The module begins with a review of transformations of parent functions and then moves to combining different function types using addition, subtraction, and multiplication....
Mathematics Vision Project
Module 7: Trigonometric Functions, Equations, and Identities
Show your class that trigonometric functions have characteristics of their own. A resource explores the features of trigonometric functions. Learners then connect those concepts to inverse trigonometric functions and trigonometric...
Mathematics Vision Project
Module 8: More Functions, More Features
A piece of this and a piece of that, add domain restrictions and create a piecewise function. Young scholars explore piecewise functions with and without context. Functions include both linear and quadratic parts. The module is the...
Mathematics Vision Project
Module 9: Modeling Data
How many different ways can you model data? Scholars learn several in the final module in a series of nine. Learners model data with dot plots, box plots, histograms, and scatter plots. They also analyze the data based on the data...
Mathematics Vision Project
Module 3: Features of Functions
Learn how to represent functions in multiple ways. Learners analyze functions as equations, graphs, and verbal descriptions. The analysis includes intercepts, behavior, domain, and range. The module of seven lessons makes up the third...
Mathematics Vision Project
Module 8: Modeling With Functions
Sometimes there just isn't a parent function that fits the situation. Help scholars learn to combine function types through operations and compositions. Learners first explore a new concept with an introductory activity and then follow...
EngageNY
Drawing a Conclusion from an Experiment (part 2)
Communicating results is just as important as getting results! Learners create a poster to highlight their findings in the experiment conducted in the previous lesson in a 30-part series. The resource provides specific criteria and...
EngageNY
Relationships Between Two Numerical Variables
Working in small groups and in pairs, classmates build an understanding of what types of relationships can be used to model individual scatter plots. The nonlinear scatter plots in this lesson on relationships between two numerical...
EngageNY
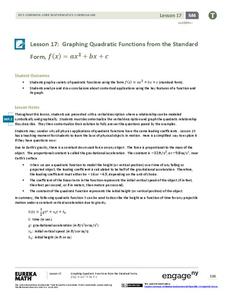
Graphing Quadratic Functions from the Standard Form
Use context to explain the importance of the key features of a graph. When context is introduced, the domain and range have meaning, which enhances understanding. Pupils use application questions to explore the key features of the graph...
EngageNY
Modeling with Quadratic Functions (part 2)
How many points are needed to define a unique parabola? Individuals work with data to answer this question. Ultimately, they determine the quadratic model when given three points. The concept is applied to data from a dropped object,...
Mathematics Assessment Project
Generalizing Patterns: The Difference of Two Squares
After completing an assessment task where they express numbers as the difference of squares (i.e., 9 = 5^2 – 4^2), class members note any patterns that they see in the problems.
Curated OER
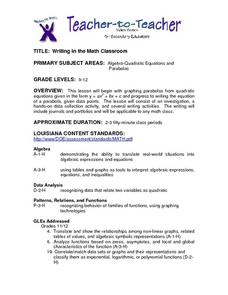
Writing in the Math Classroom
Pupils determine the vertex, y-intercept and direction of a parabola and write an explanation of how to graph a parabola. They collect and graph data using a calculator.


