Curated OER
Using Data from Sensors
Beginning with a discussion about using technology to collect data, this resource includes a video about the next Mars rover as an example. Young scientists are taught that filtering is necessary before collected data can be analyzed....
NASA
Exploring Data
Bring the sun to your class! Young scholars analyze actual solar wind data in the second lesson of a five-part series. Their analysis includes speed, temperature, and density data.
Illustrative Mathematics
Weather Graph Data
Teaching young mathematicians about collecting and analyzing data allows for a variety of fun and engaging activities. Here, children observe the weather every day for a month, recording their observations in the form of a bar graph....
NASA
Data Literacy Cube: Global Atmospheric Temperature Anomaly Data
Evaluate global temperature anomalies using real-world data from NASA! Climatologists analyze a data set using a literacy cube and differentiated question sheets. Team members evaluate global temperature anomaly data with basic...
Polar Trec
How Much Data is Enough?
The next time you read a magazine or watch the news, make note of how many graphs you see because they are everywhere! Here, scholars collect, enter, and graph data using computers. The graphs are then analyzed to aid in discussion of...
National Wildlife Federation
The Tide is High, but I’m Holding On… Using ICESat Data to Investigate Sea Level Rise
Based on the rate of melting observed from 2003-2007 in Greenland, it would take less than 10 minutes to fill the Dallas Cowboys' Stadium. The 17th lesson in a series of 21 has scholars use the ICESat data to understand the ice mass...
Howard Hughes Medical Institute
Gorongosa: Scientific Inquiry and Data Analysis
How does the scientific process begin? Introduce ecology scholars to scientific inquiry through an insightful, data-driven lesson. Partners examine data from an ongoing research study to determine the questions it answers. The resource...
Earth Watch Institute
Entering Local Groundhog Data in an Excel Spreadsheet
Here is a cross-curricular ecology and technology activity; your learners create spreadsheets depicting the location and number of groundhog dens in a local park. They research groundhogs and analyze data about where the groundhog...
Curated OER
WS 1.6 Dimensional Analysis
In this conversions worksheet, students use dimensional analysis to convert from one metric unit to another and from the English system of measurement to the metric system.
Curated OER
WS 2.5 Dimensional Analysis
Science students apply dimensional analysis to relate quantities in six different problems. They consider the cost of steak, a young man's growth rate, a medicine prescription, fuel efficiency, and more. This worksheet is a great way to...
NOAA
Ground-truthing Satellite Imagery with Drifting Buoy Data
Ground-truthing ... is it even a word? The last installment of a five-part series analyzes how scientists collect sea surface temperature data. Scholars use government websites to compare temperature data collected directly from buoys...
Chicago Botanic Garden
Plant Phenology Data Analysis
Beginning in 1851, Thoreau recorded the dates of the first spring blooms in Concord, and this data is helping scientists analyze climate change! The culminating instructional activity in the series of four has pupils graph and analyze...
Chicago Botanic Garden
Plant Phenology Data Analysis
Scientists monitor seasonal changes in plants to better understand their responses to climate change, in turn allowing them to make predictions regarding the future. The last activity in the series of six has scholars analyze BudBurst...
Omaha Zoo
I Like to Move It
What do lemurs do best? They move! Lemurs like to jump, run, hop, and climb and it's your class's job to document seven fun lemur behaviors. The class starts by discussing why lemurs are considered primates, and then they isolate seven...
Curated OER
Great Lakes Snow Analysis Collaborative Network
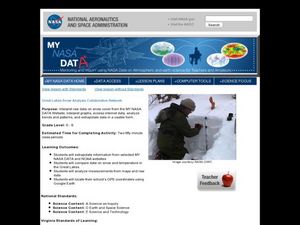
Students interpret data on snow cover and analyze trend patterns. In this snow lesson students compare data and locate their school's GPS coordinates.
Curated OER
DC Branch Current Analysis
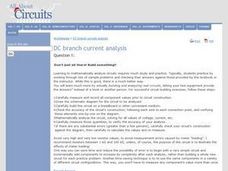
Engage your class in physics with this series of questions. The first question is the most hands-on and asks learners to build their own circuit. The rest of the questions are related to current analysis. Class members solve 7 problems...
PBS
Data Plots of Exoplanet Orbital Properties
Scientists discovered the first exoplanet in 1995 and by early 2018, they confirmed the existence of more than 3,700—that's a lot of data! As part of the PBS 9-12 Space series, scholars interpret data about exoplanets. They compare...
Howard Hughes Medical Institute
Evolution in Action: Data Analysis
An environmental factor, such as a drought, sometimes speeds up the rate of natural selection. Scholars analyze data on the beaks of birds around the time of the drought. They compare those that survived to those that perished and find...
Curated OER
Hydrogen Peroxide Analysis
A scenario is presented for chemistry techs to address. Using titration techniques, they must analyze hydrogen peroxide solution samples. They evaluate accuracy and precision in the process. They also gain experience consulting the MSDS...
Curated OER
Soil Testing
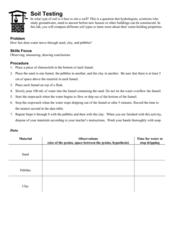
Earth science learners experiment with the water-holding properties of sand, pebbles, and clay. They apply their findings to the building of a well. This activity is engaging and tactile, and it demonstrates the importance of considering...
Howard Hughes Medical Institute
Lesson 8: WildCam Gorongosa Data Analysis
How do scientists analyze data to get a specific answer to a question? The final chapter in an eight-part series of activities centered around Gorongosa National Park encourages scholars to dig deeper into the scientific process. After...
PBS
Student Helioviewer Data Tool
Scholars use current satellite data to view solar events, solar features, and so much more. It allows them to make videos over time to observe patterns and visually understand the sun at a much higher level using the interactive that is...
National Wildlife Federation
Get Your Techno On
Desert regions are hotter for multiple reasons; the lack of vegetation causes the sun's heat to go straight into the surface and the lack of moisture means none of the heat is being transferred into evaporation. This concept, and other...
Curated OER
Deep Convective Clouds
Students observe clouds. In this deep convective clouds lesson, students analyze cloud data recorded over one month and draw conclusions based on results. Students predict "Thunderstorm Season" and prepare to defend their decision...
Other popular searches
- Data Analysis
- Literary Analysis
- Character Analysis
- Poetry Analysis
- Data
- Data, Census, & Statistics
- Character Sketch
- Word Analysis
- Analyzing Poetry
- Thinking Analysis
- Dimensional Analysis
- Analysis Song Lyrics


