EngageNY
The Difference Between Theoretical Probabilities and Estimated Probabilities
Flip a coin to determine whether the probability of heads is one-half. Pupils use simulated data to find the experimental probability of flipping a coin. Participants compare the long run relative frequency with the known theoretical...
Curated OER
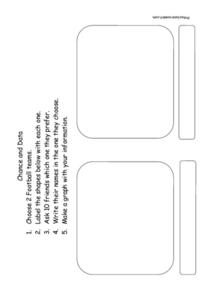
Chance and Data
In this graphing a survey activity, students poll 10 friends to see which of 2 football teams is their favorite and then graph their data results.
Curated OER
Random Sampling
For this random sampling worksheet, students compare data collected by a random sample to data collected by an actual count using pieces of paper with numbers written on them. They compare their data for the actual count to the random...
Curated OER
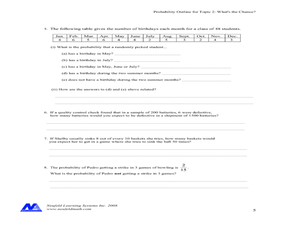
Concept: What's The Chance?
In this concept worksheet, students perform probability experiments. Using collected information, they interpret the data. Students answer questions about probability. This five-page worksheet contains approximately 15 multi-step...
EngageNY
Estimating Probabilities by Collecting Data
Take a spin to determine experimental probability. Small groups spin a spinner and keep track of the sums of the spins and calculate the resulting probabilities. Pupils use simulated frequencies to practice finding other probabilities to...
Illustrative Mathematics
Rolling Dice
Rolling dice is a great way for your mathematicians to get a hands-on approach to probabilities. Use the chart to record whether they rolled a six during ten attempts. Calculate results individually (or in small groups) and then record...
Math Warehouse
Theoretical Probability Activity
If you keep rolling a die, you'll roll a five exactly one-sixth of the time—right? A probability lesson prompts young mathematicians to roll a die 100 times and use the data to calculate empirical probabilities. They then compare these...
Illustrative Mathematics
Heads or Tails
Heads! A great way to practice probability is to flip a coin in class. The provided data allows your mathematicians to predict the probability of heads in ten coin flips. Bring coins to class and allow your own trial of heads or tails....
Illustrative Mathematics
How Many Buttons?
Bring the class into the probability by having everyone count buttons on their shirts. Organize the data into the chart provided and chose different possibilities such as "female with one button" or "all learners with more than four...
Virginia Department of Education
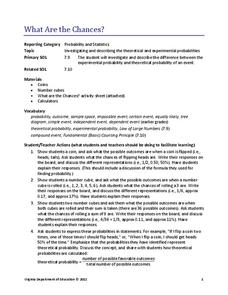
What Are the Chances?
Take a chance on an informative resource. Scholars conduct probability experiments involving coins and number cubes to generate data. Compiling class data helps connect experimental probability to theoretical probability.
Willow Tree
Data Sampling
Some say that you can make statistics say whatever you want. It is important for learners to recognize these biases. Pupils learn about sample bias and the different types of samples.
Curated OER
Problem Solving Application: Use Data to Make Predictions: Problem Solving
In this making predictions worksheet, students use the understand, plan, solve, and look back method to help them solve the questions about probability. Students use the data within the problem to predict and solve.
Curated OER
Heads & Tails Data Collection
In this data collection worksheet, students use a penny and a dime to play a math game. Students flip the money in the cup and then record the number of heads and tails showing marking the coins in the box.
Teach Engineering
Earthquakes Living Lab: Locating Earthquakes
There are patterns in nearly everything — even earthquakes. Pairs research current earthquakes to see if there are any patterns. They determine the mean, median, and mode of the earthquake data, along with the maximum and minimum. Using...
Curated OER
The Titanic 3
Can survival rates on the Titanic be explained by the "women and children first" policy or did rescue procedures favor the wealthy? Use actual historical data to explore conditional probability and independent events with your class....
Teach Engineering
Earthquakes Living Lab: Finding Epicenters and Measuring Magnitudes
Pairs use an online simulation to determine the epicenter and magnitude of an earthquake. Using real data about the earthquake's maximum S wave amplitudes, they then determine the magnitude. The resource provides a great career...
Curated OER
Research Methods in Psychology
This 5-question psychology review provided by Sparknotes addresses sampling bias, correlative data, statistical significance, and more.
Curated OER
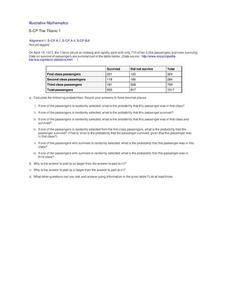
The Titanic 1
Were your chances of surviving the sinking of the Titanic better if you were a first-class passenger? Capture learners' attention with actual historical data to find the answer. They use two-way tables to calculate conditional and...
Statistics Education Web
Odd or Even? The Addition and Complement Principles of Probability
Odd or even—fifty-fifty chance? Pupils first conduct an experiment rolling a pair of dice to generate data in a probability lesson. It goes on to introduce mutually exclusive and non-mutually exclusive events, and how to use the Addition...
Howard Hughes Medical Institute
Color Variation over Time in Rock Pocket Mouse Populations
A species-specific look at natural selection, the resource herein examines how adaptations have helped the population of rock pocket mice survive in a changing landscape. To begin, middle or high schoolers watch a 10.5 minute video,...
Curated OER
Lizard Lab
In this detailed and comprehensive multi-day activity, budding evolutionary biologists use real data from lizard populations in the Canary Islands to examine evolution and natural selection.
Curated OER
Fred's Fun Factory
Round and round and round she goes. Where she stops, nobody knows. This activity uses a common arcade game of chance, the spinning wheel, as a platform for computing expected values, interpreting results, and applying this knowledge to...
NASA
The Discovery of Jupiter Radio Waves
Lead your class on a journey to the planet Jupiter and provide them with fun facts in the process. Learners explore radio waves emitted by Jupiter to further understand how this data helps our daily lives. They conclude by discussing...
S2tem Centers SC
Investigating Chance Processes of Probability
How likely is it that the school cafeteria will serve chicken tomorrow? Discover the concept of probability with the roll of the dice. Pupils evaluate the liklihood of several statments about everyday life. Then, a mathematical...
Other popular searches
- Primary Chance and Data
- Mathematics Chance and Data
- Chance and Data Cards
- Chance and Data Games
- Math Chance and Data
- Maths Chance and Data
- Math Chance and Data
- Chance and Data Worksheet


