TryEngineering
Sorting Socks is Algorithm Complexity
Use hosiery to teach computer science. Scholars use socks to develop a set of algorithms. They find ways to find a particular sock from a set and ways to sort socks. Finally, they use their algorithms to consider time complexity.
UAF Geophysical Institute
Carbon Footprint
Your young environmentalists can calculate their carbon footprint and discuss ways to reduce it with a worksheet about climate change. After reading a handout about what impact one's carbon footprint can have on the environment, kids...
NASA
Space Shuttle Ascent: Altitude vs. Time
How long did it take to get to that altitude? Using a Google Earth file, groups explore a space shuttle launch. Using a calculator, groups determine the function that models the altitude/time data from an actual launch. With the model in...
Noyce Foundation
Ducklings
The class gets their mean and median all in a row with an assessment task that uses a population of ducklings to work with data displays and measures of central tendency. Pupils create a frequency chart and calculate the mean and median....
NASA
Lunar Rover
What is the shortest distance/time needed to complete a mission? Groups devise a strategy in order to determine the shortest distance and time connecting two points and a segment. They then use graphing, the distance formula, and a...
NASA
Ascent: 50 Seconds to MECO
All systems go! With a video and a Google Earth tour as background, pairs investigate two graphs. The graphs display acceleration vs. time and velocity vs. time of a space shuttle launch. Using graphing calculators, the pairs take a...
Curated OER
Linear Programming
In this algebra worksheet, students calculate the maximum and minimum of a shaded region. They identify the boundaries and their vertices's. There are 2 problems.
NASA
Earth, Can You Hear Me Now?
How long did you say? Class groups plot the distances between Earth and Mars and determine the trigonometric function that models the data. Using a calculator, they graph the function to determine when the distance and communication...
Teach Engineering
Microfluidic Devices and Flow Rate
When you have to flow, you have to flow. The instructional activity introduces class members to microfluidic devices and their uses in medicine. They watch a short video on how the diameter affects the rate of flow. The worksheet has...
Statistics Education Web
Did I Trap the Median?
One of the key questions in statistics is whether the results are good enough. Use an activity to help pupils understand the importance of sample size and the effect it has on variability. Groups collect their own sample data and compare...
Illustrative Mathematics
Finding an Unknown Angle
Teach your class how to apply their knowledge of geometry as they explore the unknown. In order to find an unknown angle, students must understand that rectangles have four interior right angles, that right angles have 90 degrees, and...
Math Worksheets Land
Patterns of Association (Using Data Tables) - Independent Practice Worksheet
Here is a worksheet that belongs in a four-part resource that has learners practice using data tables to calculate percentages. The page has ten problems with different data tables asking to find different percents.
Curated OER
Binomial Probabilities: Understanding Math
Although this binomial probabilities worksheet is based on a computer math program (Neufeld Learning Systems: Understanding Math), it can easily be used without the program. If you don't have the program, skip the first question....
Teach Engineering
Lighting in My Classroom Survey
How much energy does it take to light a room? Class members calculate the total wattage it takes to light the classroom. Through calculations, responsible scientists determine the cost of energy for the year, then figure out how much...
Curated OER
Tides at the Battery, NY
Skill in using Excel and increasing proficiency in manipulating data are challenged with this data analysis work. A web link supplies data and step-by-step instructions help learners create a graph. There are many extension activities...
Curated OER
Classroom Supplies
Challenge young mathematicians to buy classroom supplies by staying within the means of a $1,000 budget. The mathematical activity provides learners with the opportunity to decide what items from the supply list would benefit a class of...
Illustrative Mathematics
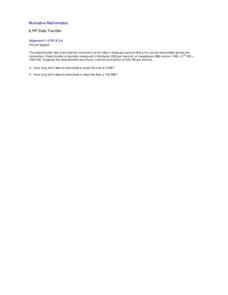
Data Transfer
A question to ask your class is, How fast is your Internet? That depends on the data transfer rate (DTR), which is the unit rate used in this activity. Math students will calculate how long it takes to download a music file and a video...
Curated OER
Spreadsheet Page 2
In this technology worksheet, students examine the definitions. The words are used in order to match the them with the bullet points.
Jason Learning
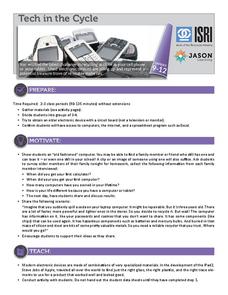
Tech in the Cycle
It might not be easy, but it is worth recycling electronics. Small groups determine the percentage of the materials that make up an iPad 2 and display the information in a circle graph. They then research the recycling process for...
Curated OER
Solving Systems: Inequalities
In this solving systems worksheet, students solve and sketch 13 systems of inequalities with a calculator and/or graph paper. Students then write 2 systems of inequalities for two graphs
Curated OER
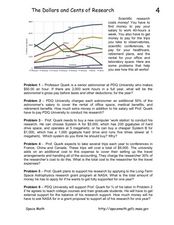
The Dollars and Cents of Research
In this cost o research worksheet, students calculate the costs to pay professors to do research, they determine the costs for equipment needed for research and they calculate the amount of money needed to support research through...
Curated OER
Studying the Equilibrium of a Water System
In this equilibrium instructional activity, students perform a computer simulation on vapor pressure of water at different temperatures to answer 11 problem solving and short answer questions about the topic.
Curated OER
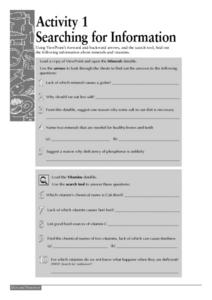
Searching for Information
In this computer worksheet, students use ViewPoint's forward and backward arrows, and the search tool to locate information given about minerals and vitamins. They load the Vitamins datafile and use the search tool to respond to five...
Curated OER
Markup, Discount, and Tax (Harder)
In this algebra worksheet, students calculate prices with taxes and percents attached. They figure the finals price for each problem after they correctly compute the taxes and percent. There are 16 problems on this worksheet.


