EngageNY
Interpreting Residuals from a Line
What does an animal's gestation period have to do with its longevity? Use residuals to determine the prediction errors based upon a least-square regression line. This second lesson on residuals shows how to use residuals to create a...
EngageNY
Analyzing Residuals (Part 2)
Learn about patterns in residual plots with an informative math lesson. Two examples make connections between the appearance of a residual plot and whether a linear model is the best model apparent. The problem set and exit ticket...
Willow Tree
Box-and-Whisker Plots
Whiskers are not just for cats! Pupils create box-and-whisker plots from given data sets. They analyze the data using the graphs as their guide.
Virginia Department of Education
Scatterplots
Math is all fun and games with this activity! Learners use an activity designed around hula hoops to collect data. They create scatter plots with their data and then analyze the graphs for correlation.
Willow Tree
Approximating a Line of Best Fit
You may be able to see patterns visually, but mathematics quantifies them. Here learners find correlation in scatterplots and write equations to represent that relationship. They fit a line to the data, find two points on the line, and...
Common Core Sheets
Determining Coordinates: Graphing Patterns
Building on their prior knowledge about patterns, this series of worksheets introduces young mathematicians to graphing in the coordinate plane. Using written descriptions of different numerical patterns, learners create sets of order...
Curated OER
Chapter Books
In this line plot worksheet, learners create a line plot of the chapter books read by the students of a class and find the median and mode. Learners complete 3 tasks.
Curated OER
Scatter Plots and Line of Best Fit – TV Task
This handout begins by asking your statisticians to form hypotheses on the correlation between test scores and student height and test scores and the number of hours watching TV. Then using specific data, your class will create scatter...
Arizona Department of Education
Introduction to Integers
Welcome to the backward world of negative numbers. This introductory lesson teaches young mathematicians that negative numbers are simply the opposite of positive numbers as they use number lines to plot and compare single-digit integers.
Curated OER
Scatter Plots
In this Algebra I/Geometry/Algebra II worksheet, students create a scatter plot and analyze the data to determine if the data show any type of correlation. The four page worksheet provides extensive explanation of topic, step-by-step...
Curated OER
Straight Line Graphs
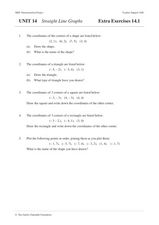
For this algebra worksheet, students graph coordinate pairs on a coordinate plane. They match points with letters and graph a line through all the plotting to create a straight line. There are 25 questions with an answer key.
Curated OER
Quiz: Scatter Plots and Line of Best Fit
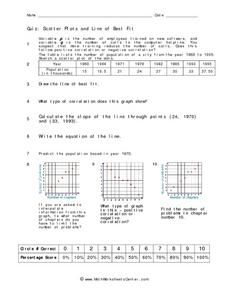
In this scatter plots and line of best fit worksheet, learners create scatter plots from given sets of data. They answer questions concerning the scatter plot. Students write the equation of a line, identify the type of correlation...
Virginia Department of Education
Exploring Statistics
Collect and analyze data to find out something interesting about classmates. Groups devise a statistical question and collect data from their group members. Individuals then create a display of their data and calculate descriptive...
Curated OER
Prescient Grading
Do homework grades really determine test scores? Learn whether lines of best fit, correlation coefficients, and residuals can be used to determine test scores when given homework grades. (It would certainly save teachers time in grading...
Curated OER
Line Graphs
In this line graphing worksheet, students read a table showing items four children "posses" and plot graphs for each child showing the distribution of objects they each have. Students plot four line graphs.
Virginia Department of Education
Graphs
Examine different types of graphs as a means for analyzing data. Math scholars identify the type of graph from a series of data displays and then develop questions to match each one. Then, given a scatter plot of height versus age data,...
Math Worksheets Land
Halloween Cartesian Art: Bat
Get the class batty over graphing. Young mathematicians plot ordered pairs in all quadrants of a Cartesian plane, and connect the points to create a bat.
Statistics Education Web
Saga of Survival (Using Data about Donner Party to Illustrate Descriptive Statistics)
What did gender have to do with the survival rates of the Donner Party? Using comparative box plots, classes compare the ages of the survivors and nonsurvivors. Using the same method, individuals make conclusions about the gender and...
Australian Centre For the Moving Image
Dreamworks Animation Character Design
Dive into animation creation using Dreamworks® animated films. Compare and contrast characters, wonder and ponder why the plot is so important, and think of background and themes as your creativity unrolls onto paper.
Curated OER
Integration: Statistics, Scatter Plots and Best-Fit Lines
In this math worksheet, students identify the type (if any) of correlation on 6 scatter plots. They use information given on a table to create a scatter plot and identify the type of correlation. Students use the scatter plot to make...
Curated OER
Super Bowl Champs
In this Super Bowl learning exercise, students create line plots of all winners and losers of the Super Bowl. They create stem-and-leaf plots, scatter plots, and bar graphs of football data. This one-page learning exercise contains 5...
Curated OER
Graphing Toys!
Jason, Michelle, Sofia, and Willis all have a variety of toys. Use the chart provided to graph how many toys each child has. Who has the most toys? Who has the least? Help your learners study the graphs they create to better understand...
Curated OER
Much Ado About Nothing: Fun Trivia Quiz
Check to see if your pupils can identify characters and basic plot points from Shakespeare's Much Ado About Nothing with this online interactive quiz. While the content is not innovative, this basic quiz could be helpful as a sponge or...
EngageNY
Motion Along a Line – Search Robots Again
We can mathematically model the path of a robot. Learners use parametric equations to find the location of a robot at a given time. They compare the paths of multiple robots looking for parallel and perpendicular relationships and...


