Annenberg Foundation
Skeeters Are Overrunning the World
Skeeters are used to model linear and exponential population growth in a wonderfully organized lesson plan including teachers' and students' notes, an assignment, graphs, tables, and equations. Filled with constant deep-reaching...
Teach Engineering
Start Networking!
Class members create their own social networks by collecting signatures before graphing the interactions with their fellow classmates. The degree distribution of the simulated social network is determined by calculating the degree of...
Saxon
Plotting Functions
Youngsters use a graphing calculator to assist in creating a function table. They graph the function on a coordinate plane. They explore the relationship between the domain and range in the graph. This four-page worksheet contains two...
Teach Engineering
Matching the Motion
It is not always easy to walk the straight and narrow. In the sixth portion of a nine-part unit, groups actively recreate a graph depicting motion. Individuals walk toward or away from a motion detector while trying to match a given...
101 Questions
CoinStar
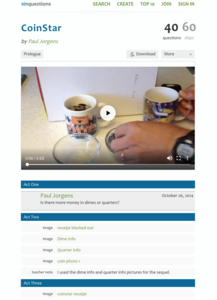
Would you rather have a bowl of dimes or a bowl of quarters? A video introduces the problem by presenting two bowls, one full of quarters and another full of dimes. Learners use information from a CoinStar receipt to calculate the number...
Baylor College
Global Atmospheric Change: The Math Link
Change up the classroom atmosphere with this interdisciplinary resource. Following along with the children's book Mr. Slaptail's Curious Contraption, these math worksheets provide practice with a wide range of topics including...
Point Pleasant Beach School District
Parabola Project
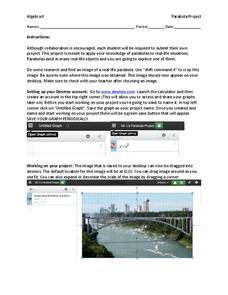
Class members select a picture that contains a parabola and construct a drawing of it using function graphs in the quadratic project. Individuals restrict the domains of the functions to create a more accurate drawing. They then submit a...
PBL Pathways
Death Project
Verify the rule of thumb for finding the time of death. The project-based learning task asks pupils to determine when the rule of thumb process of finding the time of death is appropriate. Learners develop a function for the rule and...
Curated OER
Mathemafish Population
It's shark week! In this problem, young mathematically minded marine biologists need to study the fish population by analyzing data over time. The emphasis is on understanding the average rate of change of the population and drawing...
Teach Engineering
Density Column Lab - Part 1
Mass and density — aren't they the same thing? This activity has groups use balance beams and water displacement to measure several objects. The pupils use the measurements to calculate the density of the objects.
Illustrative Mathematics
Electoral College
A cross-curricular resource that takes the electoral votes and allows your learners to organize and analyze the data. Young voters can determine which states are more influential and interpret the dotplot provided for more data....
Teach Engineering
Determining Densities
Don't be dense—use a robust resource. The second installment of a five-part Floaters and Sinkers unit has learners determine the densities of several objects. As part of the activity, they learn the displacement method for finding...
Federal Reserve Bank
FRED in the Classroom: Measures of Inflation
Don't just tell class members about how to measure inflation, have them experience it firsthand by asking them to work with real data and construct graphs!
Federal Reserve Bank
FRED in the Classroom: Debt and Deficit
Here is a hands-on activity where your class members will discover different ways to measure the government's financial situation and work to add data and redraw graphs in order to calculate the ratio of gross federal debt held by...
UAF Geophysical Institute
Carbon Footprint
Your young environmentalists can calculate their carbon footprint and discuss ways to reduce it with a worksheet about climate change. After reading a handout about what impact one's carbon footprint can have on the environment, kids...
PBL Pathways
College Costs 2
What is the financial benefit for attending a community college for the first two years before transferring to a four-year college? The second part of the educational lesson asks young scholars to explore this question through data...
PBL Pathways
College Costs
Predict the year that college costs will double in your state using linear modeling. The first part of this two-part project based learning activity asks young mathematicians to use data from the College Board. They graph the data,...
Teach Engineering
Edible Rovers (High School)
Design and build a rover ... then eat it? This activity has groups of two design and build Mars rovers. The teams determine what instruments they want to include with their rover and plan a budget. They calculate the cost of the body of...
PBL Pathways
Potassium-Argon Dating
Find the age of a fictional sample of rocks using a genuine approach. A well-designed lesson asks young mathematicians to use exponential modeling to analyze half-life. As a project-based learning activity, scholars communicate...
Teach Engineering
Energy on a Roller Coaster
Roll with your class into the idea of conservation of energy. Pupils use a roller coaster track to collect data to reinforce the concept of conservation of energy and the influence of friction. Class members then create a graph from...
Teach Engineering
Density Column Lab - Part 2
Groups suspend objects within layers of liquids to determine the densities of different liquids and compare them to the densities of objects calculated in Part 1. The groups then carefully test their calculations by layering the...
Howard Hughes Medical Institute
Tracking Genetically Modified Mosquitoes
What's that buzzing in your ear? An insightful lesson about genetically modified mosquitoes! Partnered pupils explore the creation, release, and monitoring of mosquitoes designed to reduce the mosquito population. After watching a video,...
Teach Engineering
Quantum Dots and Colors
Introduce teams to quantum dot solutions with an activity that has them expose solutions to a blacklight, observe the colors, and take measurements. Groups graph the data and analyze the dependence between particle size and...
Illustrative Mathematics
Irrational Numbers on the Number Line
There are four irrational numbers that participants need to graph. Pi(π), -(½ x π), and √17 are easy to approximate with common rational numbers. On the other hand, the commentary describing the irrational number 2√2 is not...


