Education World
Predicting Pumpkins
If you want more pumpkin seeds, you should get a bigger pumpkin—right? Young harvesters use estimation skills to make a hypothesis about how many seeds they will find in a pumpkin before examining the real number inside.
Curated OER
Making Predictions About Measurement
Upper graders experiment with measurement. They estimate the length, volume, and weight of various objects, then rotate through stations making predictions concerning measurements and then testing their predictions.
Curated OER
Probability and Prediction Cards
Which card will you draw next? This template has students cut along the dotted lines to create "Probability Cards." The cards include 2 triangles, 4 squares, and 6 circles. Students determine the different probabilities of drawing each...
EngageNY
Modeling Relationships with a Line
What linear equation will fit this data, and how close is it? Through discussion and partner work, young mathematicians learn the procedure to determine a regression line in order to make predictions from the data.
Kenan Fellows
Designing and Analyzing Data Collected from Wearable Devices to Solve Problems in Health Care
Wearable devices have become more the norm than the exception. Learners analyze data from a sample device with a regression analysis in a helpful hands-on lesson. Their focus is to determine if there is a connection between temperature...
Kenan Fellows
Applying Linear Regression to Marathon Data
It's not a sprint, it's a marathon! Statistic concepts take time to develop and understand. A guided activity provides an opportunity for individuals to practice their linear regression techniques in spreadsheet software. The activity...
PBL Pathways
Students and Teachers
Predict the future of education through a mathematical analysis. Using a project-based learning strategy, classes examine the pattern of student-to-teacher ratios over a period of years. Provided with the relevant data, learners create a...
MENSA Education & Research Foundation
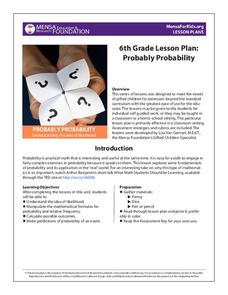
Probably Probability
Reinforce the concept of probability with a series of lessons highlighting the idea of likelihood, probability formulas, relative frequency, outcomes, and event predictions. The collection is made up of four lessons offering informative...
Curated OER
Problem-Solving Application: Making Predictions
In this problem-solving worksheet, learners learn how to make a prediction in problem-solving by using the 4 steps: understand, plan, solve and look back. They then use this problem-solving skill to answer 4 questions.
Curated OER
Using Random Sampling to Draw Inferences
Emerging statisticians develop the ability to make inferences from sample data while also working on proportional relationships in general. Here, young learners examine samples for bias, and then use random samples to make...
CK-12 Foundation
Simple Random Sampling: How Many Samples Does it Take to Change a Light Bulb?
Teach the concept of simple random sampling through an interactive lesson. Learners explore the concept by considering the strength of sampling methods. Size of the samples varies also as individuals determine which methods lead to the...
EngageNY
Events and Venn Diagrams
Time for statistics and learning to overlap! Learners examine Venn Diagrams as a means to organize data. They then use the diagrams to calculate simple and compound probabilities.
Curated OER
Collecting Data to Learn About the People Around You
Human graphs, anyone? Did you eat fruit today? What is your favorite costume? Have your K – 6 learners graph the responses. Early elementary grades may count and compare while upper grades compare responses of different groups or make...
Purdue University
The Case of the Pilfered Pin: A Measurement Inquiry Activity
Who pilfered the pin? Scholars practice measurement skills as they solve the mystery of a stolen pin. They measure length, temperature, and mass and determine which of select suspects committed the crime. During the STEM hands-on...
Project Maths
Introduction to Patterns
The world is full of patterns. Help learners quantify those patterns with mathematical representations. The first Algebra lesson in a compilation of four uses a series of activities to build the concept of patterns using multiple...
Curated OER
Going Graph-y
Second graders listen to and dicuss the story Where the Wild Things Are. They play a pantomime game and act out various feelings so their classmates can guess. They listen for the frequency of certain words, and record their findings on...
Curated OER
Weather Watchers
Students identify basic weather instruments and how they are used to record weather data. Students define several vocabulary terms as stated in lesson. Students use basic instruments to record weather data in their area. Students use the...
Curated OER
Paper Folding to Make Cubes
Examine patterns of figures composed of six-squares and predict which of the twenty presented could be folded to make a cube. They then fold large-scale patterns of these figures to confirm their hunches.
Kenan Fellows
Lego Thinking and Building
Run a simulated airplane manufacturing plant with your pupils as the builders! Learners build Lego airplane models and collect data on the rate of production, comparing the number produced to the number defective. Using linear...
Curated OER
Ten Red Apples; The Five Senses
A clever lesson designed around an apple awaits your learners. Descriptive words are used to explain what they believe is inside a bag while using their five senses. Students read the story The Apple Pie Tree and are introduced to the...
EngageNY
Normal Distributions (part 2)
From z-scores to probability. Learners put together the concepts from the previous lessons to determine the probability of a given range of outcomes. They make predictions and interpret them in the context of the problem.
Achieve
Ivy Smith Grows Up
Babies grow at an incredible rate! Demonstrate how to model growth using a linear function. Learners build the function from two data points, and then use the function to make predictions.
National Security Agency
It's Probably Probable
Learners make predictions and draw conclusions from given information as they learn the meaning of probability in this vocabulary-rich, integrated activity that presents a variety of teaching strategies to motivate and reach...
EngageNY
Interpreting Residuals from a Line
What does an animal's gestation period have to do with its longevity? Use residuals to determine the prediction errors based upon a least-square regression line. This second lesson on residuals shows how to use residuals to create a...


