Curated OER
Mount Everest History Lesson
Students explore Mount Everest. In this exploration lesson, students read "The Top of the World: Climbing Mount Everest," by Steve Jenkins. Students then respond to discussion questions and participate in a map skills activity.
Curated OER
What Is A Number?
Seventh graders engage in a lesson that is focused upon teaching the concept of integer numbers with a focus upon the integers. They practice solving different problems using positive and negative numbers. They then attempt to describe...
Curated OER
Use Models to Compare and Order Integers
Students investigate the concept of integers and how they should occur in the realm of irrational numbers. The lesson includes the use of positive and negative integers. The lesson is a good foundation in order to move into calculating...
Curated OER
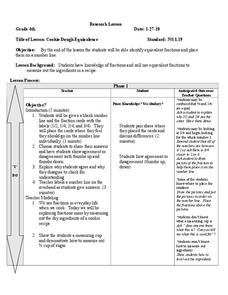
Cookie Dough Equivalence
Who doesn't love cookies? For this lesson, learners follow a recipe to make cookies, practicing their ability to compare fractions as they go. This is a wonderful way to motivate your class to practice this important skill.
Curated OER
Fall Reflections Monoprints
Create a natural autumn scene using the monoprinting method. Class members work on creating an image with reflection, foreground, and background using one line.
Curated OER
What's Outside the Window
What do your students see when they look outside the window? This project lets their imagination go wild, and lets you see what kind of daydreaming they do best. They each draw, paint, and color an image of what they imagine as they are...
EngageNY
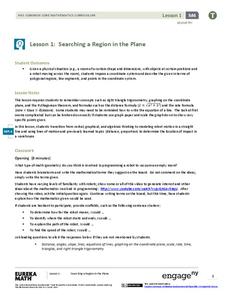
Searching a Region in the Plane
Programming a robot is a mathematical task! The activity asks learners to examine the process of programming a robot to vacuum a room. They use a coordinate plane to model the room, write equations to represent movement, determine the...
Curated OER
Shaping the View: Composition Basics
Students examine the elements of composition in various artworks. They analyze and discuss paintings, explore "The National Gallery of Art" website, identify the shape of compositions in paintings, and draw a diagram.
Noyce Foundation
The Shape of Things
Investigate the attributes of polygons. A thorough set of lessons presents problem scenarios for elementary through high school classes. The first lessons focus on basic characteristics of polygons, including the line of symmetry. As the...
Curated OER
Slope, Vectors, and Wind Pressure
A hands-on lesson using the TI-CBR Motion Detector to provide information to graph and analyze. The class uses this information to calculate the slope of motion graphs and differentiate scalar and vector quantities. There is a real-world...
Texas Education Agency (TEA)
Architectural Rendering
Explore different methods of architectural rendering and technical drawing. Pupils learn about cross hatching, parallel line rendering, random line rendering, rubbing, shading, and stippling in the second lesson of the series of 11....
West Contra Costa Unified School District
Work Problems – Bar Models
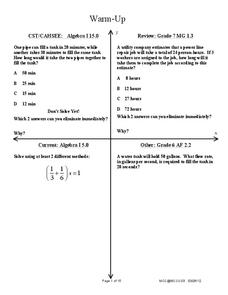
Why do we have to do so much work? Scholars learn how to set up bar models to represent a situation involving work. They use these bar models to help set up equations with rational coefficients to solve the problem situation.
Jessica Winston
Gingerbread Friends Lesson Plan Guide
Full of activities for Jan Brett's story "Gingerbread Friends," this resource will get your kids in the mood for some snacks, fortify their need for vocabulary, and fill their minds with story elements.
West Contra Costa Unified School District
Key Features of Graphs
The key is ... After a day of instruction on key features of graphs, groups create a poster and presentation on the key features of their given function graph. The resource provides an extension activity of "telephone" using...
CK-12 Foundation
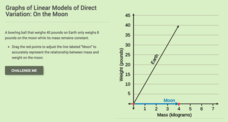
Graphs of Linear Model of Direct Variation: On the Moon
You'll be over the moon about this resource. Scholars draw a line representing the weight of an object on the moon based on its mass. Consideration of the constant of proportionality allows them to see relationships between weight of an...
Curated OER
NCTA Lesson Plan on China
Students identify China's geography, especially arable land, rainfall, crop growing areas, rivers, and mountains. Students select a technological advance to draw a diagram of the particular advance make transparencies of the diagram,...
Curated OER
Ocean Scale Drawing
Students explain how to make pictures larger using a grid system by transferring scales images from 1/2 -1 inch to 6 inches - 1 foot. They create life-size scale drawings of ocean life studied in class using a grid system.
Curated OER
Texture: Wild Things
Students experiment with different kinds of marking techniques. They read "Where the Wild Things Are" and observe animals for pattern and line. They compare illustrations with Haring's images. They create a symbolic drawing of animal.
Curated OER
Measurement
Fifth graders measure specified distances when given perpendicular lines. In this measurement lesson plan, 5th graders draw the lines themselves.
Curated OER
Linear Equations
In this algebra worksheet, learners solve and graph linear equations. They differentiate between parallel and perpendicular lines. There are 35 questions about graphing.
Curated OER
Symmetrical Designs with Pretzels and Marshmallows
Fifth graders create designs that have lines of symmetry using pretzel and marshmallows. In this symmetry design lesson plan, 5th graders work in groups using graph paper, rulers, and toothpicks to plan their own lines of symmetry...
Curated OER
What's The Idea?
Sixth graders explore line segments, rays, parallel, perpendicular and intersecting lines. The teacher discusses, with the class, real life items that represent each geometric idea studied. They use cotton balls, strings and popsicle...
Curated OER
Doodle Animals
Fifth graders explore the abstract form of drawing of Paul Klee. They create a drawing of an animal using contour line in the same style.
Curated OER
Which Graph is best?
Students use commercial software to organize and visually display data to draw conclusions; students use graphing software to create several types of graphs illustrating the number of each color of M&M's in one bag.


