Curated OER
Linear Equations
Students solve linear equations by modeling. In this algebra lesson plan, students solve one and two step inequalities and equations. They use manipulative to create a visual of the steps.
Curated OER
Piecewise Modeling with Multiple Functions: Federal Debt
Students analyze data on debt and write an equation. In this statistics lesson, students are given data from different time periods, and are asked to graph and analyze the data. They work in groups, and are assigned different parts of...
Curated OER
Linear Functions: Slope, Graphs, and Models
This math packet provides an opportunity for learners to graph two linear equations on a coordinate grid and determine the slope and y-intercept of each. They use the equation of five lines to find the slope and y-intercepts, and then...
Curated OER
Solving Linear Equations
Use this learning exercise for practice or review solving linear equations in one variable. Problems range from multiple-step problems involving parentheses and combining like terms, to word problems, to equations with no solution or...
Curated OER
Linear and Exponential Models
Linear or exponential, see if your class can tell the difference. This very basic worksheet looks at different representations including tables of values, graphing, and an equation to assess understanding. This would make a good warm-up...
Curated OER
Introducing y = mx + b
Middle and high schoolers use the slope intercept form to graph a line. In this algebra instructional activity, pupils rewrite equations from standard form to y-intercept form. They use the slope and y-intercept to graph a line without...
EngageNY
Analyzing Residuals (Part 2)
Learn about patterns in residual plots with an informative math activity. Two examples make connections between the appearance of a residual plot and whether a linear model is the best model apparent. The problem set and exit ticket...
CK-12 Foundation
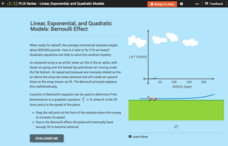
Linear, Exponential, and Quadratic Models: Bernoulli Effect
How can an object as heavy as an airplane fly? Turns out the answer is quadratic! Your classes explore the Bernoulli Effect through an interactive graph representation. As a plane increases in speed, the lift force also increases. Young...
CK-12 Foundation
Problem-Solving Models: Subway vs. Taxi
Ride to success in understanding systems of equations. Scholars graph a system of equations on the cost of a subway and a taxi using an interactive. Using this graph allows users to answer some questions about the situation.
Memorial Art Gallery
Learning to Look, Looking to Learn - Peeling Onions
Lilly Martin Spencer's "Peeling Onions" is the subject of a series of exercises that model for learners how to use the elements of art to read a painting. A series of worksheets focus viewers' attention on how Spencer uses...
Curated OER
Triangles Inscribed in a Circle
Are you tired of answers without understanding? Learners can give a correct response, but do they really understand the concept? Have young mathematicians think deeper about linear functions, angles, and formulas in algebra....
Mathematics Common Core Toolbox
Golf Balls in Water
Here's a resource that models rising water levels with a linear function. The task contains three parts about the level of water in a cylinder in relationship to the number of golf balls placed in it. Class members analyze the data and...
Kenan Fellows
Lego Thinking and Building
Run a simulated airplane manufacturing plant with your pupils as the builders! Learners build Lego airplane models and collect data on the rate of production, comparing the number produced to the number defective. Using linear...
Curated OER
Sandia Aerial Tram
Your learners analyze a table of real-life data in order to write an equation that best models the information. Exponential, quadratic, and linear rates of changes are all possibilities in this task.
Curated OER
Interpreting Graphs
Sixth graders interpret linear and nonlinear graphs. They create graphs based on a problem set. Next, they represent quantitive relationships on a graph and write a story related to graphing.
Mathematics Vision Project
Module 1: Functions and Their Inverses
Nothing better than the original! Help your class understand the relationship of an inverse function to its original function. Learners study the connection between the original function and its inverse through algebraic properties,...
Mathematics Vision Project
Module 1: Functions and Their Inverses
Undo a function to create a new one. The inverse of a function does just that. An inquiry-based lesson examines the result of reversing the variables of a function, beginning with linear patterns and advancing to quadratic and...
Curated OER
Get a Half Life!: Student Worksheet
Upper elementary or middle schoolers will explore non-linear functions, graphing, and the curve of best fit through real-life data collection and trial analysis. They explore the concept of half-life and radioactive decay using M&Ms,...
Annenberg Foundation
Skeeters Are Overrunning the World
Skeeters are used to model linear and exponential population growth in a wonderfully organized lesson plan including teachers' and students' notes, an assignment, graphs, tables, and equations. Filled with constant deep-reaching...
Curated OER
Basketball Bounces, Assessment Variation 2
This un-scaffold summative assessment tasks learners to use the height of a bouncing basketball, given the data in graph and table form, to choose the model that is represented. Learners then use the model to answer questions about...
Curated OER
Basketball Bounces, Assessment Variation 1
This highly scaffolded, summative assessment tasks learners to choose the model that represents the height of a bouncing basketball given the data in graph and table form. Learners then use the model to answer questions about the...
EngageNY
Successive Differences in Polynomials
Don't give your classes the third degree when working with polynomials! Teach them to recognize the successive differences and identify the degree of the polynomial. The instructional activity leads learners through a process to develop...
Curated OER
A Day at the Beach
Help learners determine the rate of change for the temperature of sand. They will collect data on the temperature of wet and dry sand over time with a heat lamp overhead. Then make a scatter plot of the data and find a linear model to...
Curated OER
Applying Properties to Variables
Eighth graders combine like terms in this properties of variables lesson. Using named items (stars, moons and hearts), they combine like terms using variables. They use the distributive property to combine like terms. Finally, they write...

