Albert Shanker Institute
Economic Causes of the March on Washington
Money can't buy happiness, but it can put food on the table and pay the bills. The first of a five-lesson unit teaches pupils about the unemployment rate in 1963 and its relationship with the March on Washington. They learn how to create...
Curated OER
A Walk Through Time
Students investigate the types of footwear worn during ten periods of history. In this secondary, art/math/social studies lesson, students view documentaries and popular films to study the time periods. Students research the...
Curated OER
Finding Remainders in Pascal's Triangle
Students use clock arithmetic to find remainders. In this patterns in math lesson, students explore the relationship between clock arithmetic and remainders using a computer applet. Students also identify patterns in Pascal's triangle...
Curated OER
Data Analysis Digital Display
Students create a survey online. In this math lesson plan, students graph survey data using flisti.com. They share and analyze their classmates' histogram.
California Department of Education
I Have “M.I.” Strengths!
There are so many ways to be smart! Can your class identify their intelligences? The third of five career and college lesson plans designed for sixth graders challenges them to assess their unique skills. Once they determine their...
Curated OER
Calculate the Slope of a Line Using Two Points
Find that slope! This video does an excellent job of demonstrating how to use the slope formula to find the slope of a line using two points. The instructor first reviews the definition of slope of a line, then works three problems using...
EngageNY
Estimating Probability Distributions Empirically 2
Develop probability distributions from simulations. Young mathematicians use simulations to collect data. They use the data to draw graphs of probability distributions for the random variable in question.
EngageNY
End-of-Module Assessment Task - Geometry (module 1)
Have you hit a wall when trying to create performance task questions? Several open-ended response questions require a deep level of thinking. Topics include triangle congruence, quadrilaterals, special segments, constructions, and...
EngageNY
Interpreting Residuals from a Line
What does an animal's gestation period have to do with its longevity? Use residuals to determine the prediction errors based upon a least-square regression line. This second lesson on residuals shows how to use residuals to create a...
American Statistical Association
How Fast Are You?
Quick! Snap up the instructional activity. Scholars first use an online app to collect data on reaction times by clicking a button when the color of a box changes. They then plot and analyze the data by considering measures of center,...
West Contra Costa Unified School District
Introduction to Trigonometric Functions
Scholars first learn the definitions of the sine ratio, the cosine ratio, and the tangent ratio. After mastering these definitions, they use the new information to solve triangles.
EngageNY
Perimeter and Area of Polygonal Regions Defined by Systems of Inequalities
When algebra and geometry get together, good things happen! Given a system of inequalities that create a quadrilateral, learners graph and find vertices. They then use the vertices and Green's Theorem to find the area and perimeter of...
EngageNY
Comparing Methods—Long Division, Again?
Remember long division from fifth grade? Use the same algorithm to divide polynomials. Learners develop a strategy for dividing polynomials using what they remember from dividing whole numbers.
EngageNY
Normal Distributions (part 1)
Don't allow your pupils to become outliers! As learners examine normal distributions by calculating z-scores, they compare outcomes by analyzing the z-scores for each.
EngageNY
Multiplying Polynomials
There's only one way to multiply, right? Not when it comes to polynomials. Reach each individual by incorporating various representations to multiplying polynomials. This lesson approaches multiplying polynomials from all angles. Build...
EngageNY
Solving and Graphing Inequalities Joined by “And” or “Or”
Guide your class through the intricacies of solving compound inequalities with a resource that compares solutions of an equation, less than inequality, and greater than inequality. Once pupils understand the differences, the...
EngageNY
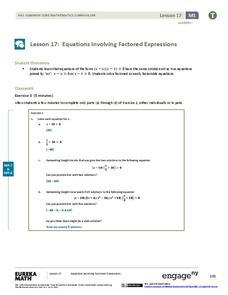
Equations Involving Factored Expressions
Be ready mathematicians of every level. This lesson leads to the discovery of the zero product property and provides challenges for early finishers along the way. At conclusion, pupils understand the process of using the zero product...
EngageNY
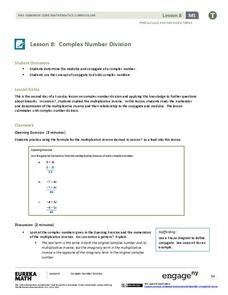
Complex Number Division 2
Individuals learn to divide and conquer complex numbers with a little help from moduli and conjugates. In the second lesson plan on complex number division, the class takes a closer look at the numerator and denominator of the...
EngageNY
Mid-Module Assessment Task - Geometry (Module 1)
How do you prepare class members for the analytical thinking they will need in the real world? An assessment requires the higher order thinking they need to be successful. The module focuses on the concept of rigid transformations...
Mathematics Assessment Project
Representing Probabilities: Medical Testing
Test probability concepts with an activity that asks pupils to first complete a task investigating false positive in medical testing and then to evaluate sample responses to the same task.
Mathematics Assessment Project
Solving Quadratic Equations
Scholars first complete an individual assignment using a quadratic equation to model the movement of a bus around a corner. Learners then discuss their solutions with classmates and analyze the provided sample responses.
West Contra Costa Unified School District
Graphing Systems
Get hands on with solving systems of equations graphically. A solid lesson plan uses guided practice to show how to solve systems of linear equations. It allows time for sharing ideas and provides a printable matching activity...
EngageNY
Graphs of Exponential Functions
What does an exponential pattern look like in real life? After viewing a video of the population growth of bacteria, learners use the real-life scenario to collect data and graph the result. Their conclusion should be a new type of...
EngageNY
Exponential Growth—U.S. Population and World Population
Show how exponential growth can look linear. Pupils come to understand the importance of looking at the entire picture as they compare the US population to the world population. Initially, the populations look linear with the same rate...
Other popular searches
- Common Core Math
- Common Core Math Lessons
- Math Common Core Lesson Plans
- Math Common Core Standards
- Common Core Kindergarten Math
- Common Core Math Fractions


