Charleston School District
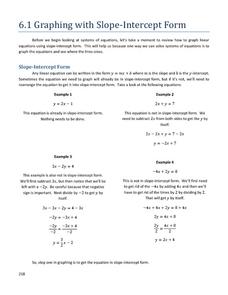
Graphing with Slope-Intercept Form
Work on graphing linear equations using the provided materials. The print and video lesson thoroughly review the concepts related to graphing linear equations in slope-intercept and standard form. The materials prepare learners for...
Curated OER
Five Colors Bar Graph-Make a Bar Graph
Two worksheets are provided here that contain the same information but ask different questions. The first worksheet has the learner draw the graph themselves before answering the questions that follow, and the second worksheet has the...
Curated OER
Complete the Graphs
First, second, and third graders make pictographs. There are four graphs to complete, and the answer sheet is included. Consider providing your learners with special needs two sets of stickers to use, instead of requiring them to draw...
Houghton Mifflin Harcourt
Unit 3 Math Vocabulary Cards (Grade 3)
Looking for math vocabulary cards for third graders? Use a set of 15 math cards with terms associated with graphing. The top half of each sheet has the vocabulary word printed in bold text, and the bottom half includes...
Balanced Assessment
A Run for Two
Develop a graph to represent the distance between two cars. The assessment task presents a scenario in which two cars are traveling at constant speeds with one faster than the other. Pupils develop graphical representations to show the...
Curated OER
Graph, Identify Asymptotes, Find Domain and Range, for Eleven Simple Rational Functions
Using this worksheet, pupils graph 11 simple rational functions. They also find asymptotes, domain, and range for each function. The solutions are provided.
PHET
Graphing Quadratics
Quadratics only have three terms, but each one is fairly important. Scholars use an interactive to explore how each coefficient affects the graph of a quadratic function. They also see how changes to the vertex form and how changes to...
Corbett Maths
Area under a Graph
What? The calculation of area is a linear distance? A short video shows how to use the areas of simple polygons to estimate the area under a graph. Pupils divide the area under a curve into figures to easier calculate the area. Given...
PHET
Graphing Slope-Intercept
Slope-intercept form ... perhaps it has something to do with slope and intercepts? An easy-to-use interactive lets users adjust the locations of two points on a line. The interactive automatically updates the slope-intercept form of the...
Corbett Maths
Transformations of Graphs
Geometric transformations in algebra ... what? Given four transformations, the narrator explains how each affect the graph of the original function. The transformations involve translations and reflections, both horizontally and...
Math Worksheets Land
Pie or Circle Graphs - Matching Worksheet
It's one thing to be able to read a pie graph, but it's another to analyze a pie graph and match it to its data table. Use a multiple choice instructional activity when challenging learners to practice this skill....
Houghton Mifflin Harcourt
Unit 2 Math Vocabulary Cards (Grade K)
Looking for some math vocabulary cards for young mathematicians? A set of 18 vocabulary cards is a great addition to a kindergarten math lesson. The top half of each sheet contains the word in bold text, while the bottom is a...
Houghton Mifflin Harcourt
Unit 5 Math Vocabulary Cards (Grade K)
Bring a resource with 20 math vocabulary cards to a kindergarten math class. The top half of each sheet contains the word in bold text, while the bottom half is a picture representing the meaning of the word. The words on the cards...
Houghton Mifflin Harcourt
Unit 8 Math Vocabulary Cards (Grade 5)
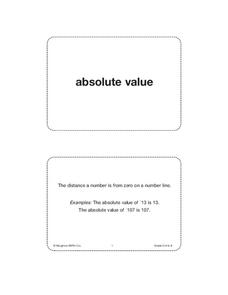
Reinforce math vocabulary with a set of flash cards. With a total of forty-eight cards, each are printed in bold font, and include definition cards that offer a labeled example. Terms include absolute value, ordered...
Houghton Mifflin Harcourt
Unit 4 Math Vocabulary Cards (Grade 6)
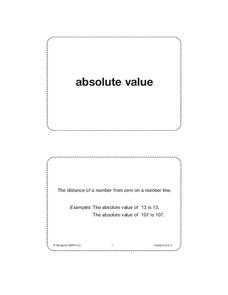
Reinforce math vocabulary with a set of flash cards. Forty-eight cards offer boldly printed words, and their corresponding definition alongside an example with labels. Terms include absolute value, inverse operations, slope, and more!
Curated OER
Going Graph-y
Second graders listen to and dicuss the story Where the Wild Things Are. They play a pantomime game and act out various feelings so their classmates can guess. They listen for the frequency of certain words, and record their findings on...
Scholastic
Study Jams! Double-Line Graphs
With two summers of babysitting money, Mia needs a way to compare her earning from both years. Show your learners that they can organize the data onto a double-line graph to easily compare which summer was more profitable. The lesson...
Public Schools of North Carolina
Math Stars: A Problem-Solving Newsletter Grade 3
Make sure your class stays up with the times using this series of math newsletters. Including word problems that cover topics ranging from consumer math and symmetry to graphing and probability, these worksheets are a...
University of North Texas
Reading Graphs
There is more to the eye than just a graph on paper. The presentation shows three different piecewise graphs and asks an assortment of questions. The resource includes topics such as domain and range, intervals of increasing and...
EngageNY
Identifying Proportional and Non-Proportional Relationships in Graphs 2
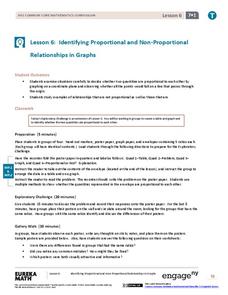
Work together to find proportional relationships. The sixth portion of the 22-part unit is a collaborative exercise. Teams work with given representations of relationships and determine if they are proportional by creating tables and...
CK-12 Foundation
CK-12 Middle School Math Concepts - Grade 6
Twelve chapters cover a multitude of math concepts found in the Common Core standards for sixth grade. Each title provides a brief explanation of what you will find inside the chapter—concepts from which you can click on and learn more...
Macmillan Education
Sine and Cosine Graphs
Learners compare and contrast sine and cosine graphs in order to describe their characteristics in a collaborative activity. As they explain their reasoning, learners strengthen their writing and vocabulary skills associated with...
Curated OER
Which Holiday Parades Have You Seen?: Graph
First graders ask their classmates which holiday parades they have seen and record the responses to complete the graph. A basic lesson, but great for teaching or strengthening graphic skills.
EngageNY
Graphing Solutions to Inequalities
Activate the strengths of your visual learners using an informative instructional activity. In the 15th installment of the series of 28, pupils graph their solutions on number lines to create a visual representation of solutions....
Other popular searches
- Charts and Graphs Math
- Hidden Picture Math Graphs
- Misleading Graphs Math
- Powerpoint Math Graphs
- 1st Grade Math Graphs
- Math Graphs 4th Grade
- Math Reading Graphs
- Animals Math Graphs
- Math Graphs Grade 1
- Creating Math Graphs
- Math Graphs Using M&ms
- Math Interpreting Graphs


