EngageNY
End-of-Module Assessment Task: Grade 6 Math Module 4
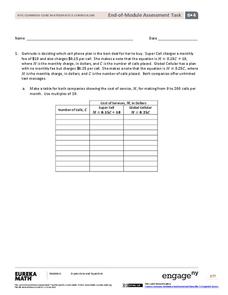
Finish out the module with a bang. The last installment of a 36-part module is an end-of-module assessment task. Test takers set up equations to represent relationships and solve problems in an assortment of contexts.
EngageNY
Writing and Graphing Inequalities in Real-World Problems
Inequalities: when one solution just doesn't suffice. Individuals learn to write inequalities in real-world contexts and graph solution sets on the number line. All inequalities in the lesson are of the form x < c or x < c.
EngageNY
Operations with Numbers in Scientific Notation
Demonstrate the use of scientific notation within word problems. The lesson presents problems with large numbers best represented with scientific notation. Pupils use these numbers to solve the problems in the 11th installment in a...
Curated OER
My Reading Words in My Social Studies Book?
Connect social studies and language arts using this resource. After studying root words, have learners locate five words from their social studies book that have a prefix, suffix, or root word. This puts a new twist on practicing basic...
Curated OER
Problems in Context
In this Pythagoras' Theorem worksheet, students read through an explanation of how to solve problems with Pythagoras' Theorem and answer 4 questions in the explanation. Then, students use Pythagoras' Theorem to answer 6 problems. They...
Mathematics Common Core Toolbox
Golf Balls in Water
Here's a resource that models rising water levels with a linear function. The task contains three parts about the level of water in a cylinder in relationship to the number of golf balls placed in it. Class members analyze the data and...
Charleston School District
Contextualizing Function Qualities
Let the graph tell the story! Adding context to graphs allows learners to analyze the key features of the function. They make conclusions about the situation based on the areas the graph is increasing, decreasing, or has a maximum...
BW Walch
Creating Linear Equations in One Variable
The example of two travelers meeting somewhere along the road has been a stereotypical joke about algebra as long as algebra has existed. Here in this detailed presentation, this old trope gets a careful and approachable treatment....
EngageNY
Grade 5 Math Module 1, Topic F, Lesson 16
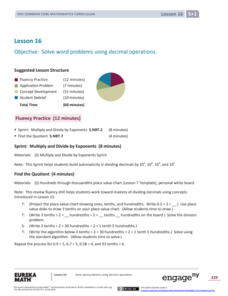
See, decimal operations do come in handy! Pupils solve word problems that require adding, subtracting, multiplying, and dividing decimals. They use tape diagrams to express relationships and to identify the necessary operations to solve...
Curated OER
Bread in a Bag
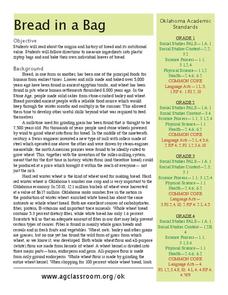
Could the history of bread really be interesting? Yes, it could! An informational text gives scholars wheat production background from 8,000 years ago, discussing different types of bread and the current industry in Oklahoma. Learners...
EngageNY
Comparing Quadratic, Square Root, and Cube Root Functions Represented in Different Ways
Need a real scenario to compare functions? This lesson plan has it all! Through application, individuals model using different types of functions. They analyze each in terms of the context using the key features of the graphs.
K5 Learning
The Bonfire in the Sea
Ever wonder why fish disappear from the surface of the water in cold weather? Fifth graders read a fun story about the magical fish tribe and their underwater bonfire before answering four comprehension questions.
Georgia Department of Education
Math Class
Young analysts use real (provided) data from a class's test scores to practice using statistical tools. Not only do learners calculate measures of center and spread (including mean, median, deviation, and IQ range), but...
University of Kansas
Exponential and Logarithm Problems
This worksheet manages to provide both fun and serious work solving exponential and logarithmic application problems in engaging story lines and real-life situations. A strong emphasis on science applications and numbers pulled...
Illustrative Mathematics
How Many Cells Are in the Human Body?
Investigating the large numbers of science is the task in a simple but deep activity. Given a one-sentence problem set-up and some basic assumptions, the class sets off on an open-ended investigation that really gives some...
EngageNY
Real-World Positive and Negative Numbers and Zero
Class members investigate how positive and negative numbers are useful in the real world. Individuals first read a short passage and identify terms indicating positive and negative numbers. They consider situations involving positive...
Illustrative Mathematics
It's Warmer in Miami
Brrrr it's cold in Alaska! When given the temperatures of Anchorage and Miami in the winter, your mathematicians will calculate how much warmer it is in Miami. Answer key provides two different solution choices. Great as a warm-up for...
Illustrative Mathematics
How Many Containers in One Cup / Cups in One Container?
The object is to model fraction division by asking “How many are in one group?” It is a difficult concept to understand, but developing the model that shows one cup to a certain amount of container or one container to a certain amount of...
Illustrative Mathematics
Money in the Piggy Bank
It's time to crack open that piggy bank and see what's inside. First, count up the pennies, nickels, dimes, and quarters, identifying what fraction of them are dimes. Then calculate the total value of the coins, writing another fraction...
EngageNY
Sampling Variability in the Sample Mean (part 1)
How accurate is data collected from a sample? Learners answer this question using a simulation to model data collected from a sample population. They analyze the data to understand the variability in the results.
Math Solutions
Dr. Seuss Comes to Middle School Math Class
If you think Dr. Seuss has no place in a math classroom, then take a look at this resource. Based on the classic children's book Green Eggs and Ham, this sequence of activities engages children learning to model real-world contexts...
American Farm Bureau Foundation for Agriculture
Shapes in Agriculture
It's time to get crafty with shapes! Your future farmers demonstrate their geometric ability by building a farm using triangles, circles, rectangles, and squares. But first, scholars take part in a brainstorm session inspired by their...
EngageNY
Sampling Variability in the Sample Proportion (part 1)
Increase your sample and increase your accuracy! Scholars complete an activity that compares sample size to variability in results. Learners realize that the greater the sample size, the smaller the range in the distribution of sample...
Illustrative Mathematics
Extensions, Bisections and Dissections in a Rectangle
Gaining practice in translating a verbal description into a diagram and then an equation is the real point of this similar triangles exercise. Once the diagram is drawn, multiple methods are provided to reach the conclusion. An effective...
