Curated OER
Pounds and Ounces: It's All About Weight
First graders explore number sense by participating in a measurement estimation activity. In this weight lesson, 1st graders discuss the differences between measurement units, both English and Metric. Students examine a loaf of bread to...
Curated OER
The Multiplier (larger 2-digit by 1-digit numbers)
Students utilize number sense applications to multiply two digit numbers. They use "The Multiplier" and Internet source to partition and solve 2 digit by 1 digit multiplications. Students describe how to solve 2-digit by 1-digit...
Curated OER
Oral Language in Mathematics
Third graders examine fractions by descriptively writing about them. For this number sense lesson, 3rd graders read number sentences and compare fractions based on their size. Students explain fractions to a friend by writing a friendly...
Curated OER
Estimating Solutions to Word Problems
Fourth graders explore number sense by completing word problems in class. In this estimation lesson, 4th graders define terms such as sum, difference, estimate and best. Students complete estimating worksheets based on the concept of...
Curated OER
Math Lesson: Just How Many is a "Million Dead"?
Learners are able to convert large numbers into meaningful ratios. They are able to conceptualize 1 million. Students grapple with the concept of a million. They use this activity to convey the idea of millions by converting war death...
Curated OER
Adding Integers with Counters
Learners add integers and use counters to create a visual. In this algebra lesson, students work in pairs as they use the computer to add integers. They complete an assessment on adding integers at the end of the activity.
Curated OER
The Golden Ratio
Seventh graders investigate a ratio found in nature and in numerous pieces of artwork throughout history. The lesson is cross-curricular and builds a sense of appreciation of design for students.
Curated OER
Veggie Chop and Data Analysis
First graders chop vegetables into fractions. In this fractions lesson plan, 1st graders cut vegetables, collect data about favorite vegetables and create a bar graph using the information. Students make inferences about the data...
Curated OER
Rice and More Rice
Fifth graders explore problem solving strategies for mathematical estimation. In this math problem solving instructional activity, 5th graders predict how many grains of rice are in a jar, practice establishing and looking for patterns...
Curated OER
Puzzled by Word Problems? See the Solution!
Students apply basic number concepts and computation skills while discovering problem-solving strategies. The contribute to a group activity, while demonstrating a knowledge of math problem solving with individual dry-erase boards so...
Teach Engineering
Who Can Make the Best Coordinate System?
Working with a map that does not have a coordinate system on it, small, collaborative teams must come up with a coordinate system for their map. Groups then explain their coordinate structure to the class.
Kenan Fellows
Reading Airline Maintenance Graphs
Airline mechanics must be precise, or the consequences could be deadly. Their target ranges alter with changes in temperature and pressure. When preparing an airplane for flight, you must read a maintenance graph. The second lesson of...
EngageNY
Base 10 and Scientific Notation
Use a resource on which you can base your lesson on base 10 and scientific notation. The second installment of a 35-part module presents scholars with a review of scientific notation. After getting comfortable with scientific...
Statistics Education Web
Text Messaging is Time Consuming! What Gives?
The more you text, the less you study. Have classes test this hypothesis or another question related to text messages. Using real data, learners use technology to create a scatter plot and calculate a regression line. They create a dot...
Statistics Education Web
The Case of the Careless Zookeeper
Herbivores and carnivores just don't get along. Using a box of animal crackers, classes collect data about the injury status of herbivores and carnivores in the box. They complete the process of chi-square testing on the data from...
Statistics Education Web
Walk the Line
How confident are you? Explore the meaning of a confidence interval using class collected data. Learners analyze data and follow the steps to determine a 95 percent confidence interval. They then interpret the meaning of the confidence...
American Statistical Association
What is the Probability of “Pigging Out”
Learners apply their understanding of luck to a probability experiment. They play a game of Pass the Pigs to determine the probability of a specific outcome. Using analysis for their data, pupils declare the measures of center, dot...
Illustrative Mathematics
Similar Circles
Young geometers flex their transformation muscles in this brief but powerful exercise using dilations and translations to develop the similarity of circles. The plan provides guidelines to help learners navigate a pair of...
American Statistical Association
Scatter It! (Using Census Results to Help Predict Melissa’s Height)
Pupils use the provided census data to guess the future height of a child. They organize and plot the data, solve for the line of best fit, and determine the likely height and range for a specific age.
American Statistical Association
Tell it Like it is!
Scholars apply prior knowledge of statistics to write a conclusion. They summarize using correct academic language and tell the story of the data.
Mathematics Assessment Project
Designing 3d Products: Candy Cartons
Wouldn't it be great to work in a candy factory? Learners get their chance as they first design a carton for a candy that meets certain requirements. They then examine and analyze nets and explanations in sample student responses.
West Contra Costa Unified School District
Shifting Linear Equations in Function Notation
Time for a shift in thinking! Learners examine translations of linear functions. They use function notation to describe the translation and make connections to the graph.
NASA
Lights on the International Space Station
Groups explore illumination with NASA's Lighting Environment Test Facility (LETF) as a context. Using the TI-Nspire app, groups determine the lux equation that models their simulation. They then use the lux equation to...
West Contra Costa Unified School District
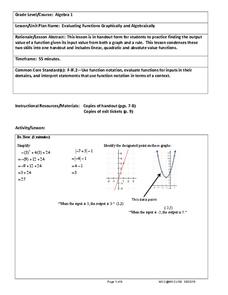
Evaluating Functions Graphically and Algebraically
High schoolers evaluate functions graphically and algebraically. After completing that step, they write a statement describing the input and output.


