Curated OER
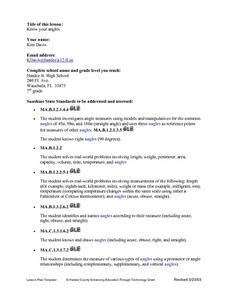
Know Your Angles
Explore types of angles and the characteristics of each. After observing a PowerPoint Presentation, learners tour the school facilities and use a digital camera to capture prescribed angles. Using the digital pictures and written...
Curated OER
Book Club Order
Students complete a simulated book order form for their class. In this book club lesson, students budget and plan an order form for their fellow students, discussing why they chose specific books.
Statistics Education Web
What Does the Normal Distribution Sound Like?
Groups collect data describing the number of times a bag of microwave popcorn pops at given intervals. Participants discover that the data fits a normal curve and answer questions based on the distribution of this data.
Statistics Education Web
10,000 Steps?
Conduct an experiment to determine the accuracy of pedometers versus pedometer apps. Class members collect data from each device, analyze the data using a hypothesis test, and determine if there is a significant difference...
Alabama Learning Exchange
Unit Circle: Special Angles—Just Know One
It's all about the patterns! Young scholars learn that the unit circle repeats itself in all four quadrants. Using these patterns, they evaluate the sine, cosine, and tangent of special angles.
American Statistical Association
Happy Birthday to . . . Two?
How many people do you need in a room before two likely share the same birthday? Scholars consider this puzzle by analyzing a set of data. They ponder how to divide the data and determine the proper size of a group for this event to...
Curated OER
Olympic Decimals
Add competitive event times, expressed in decimals, to determine the winners! Individuals use a chart showing competitors' times in four events to figure each team's total time and individual standing.
Curated OER
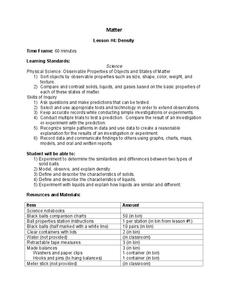
Density
Learners predict when an object will float or sink based on comparison of density of the object to the density of the substance in which it is placed. The access a website and sketch the object in the first column of their table and then...
Curated OER
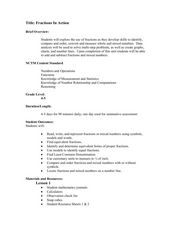
Fractions in Action
Investigate equivalent fractions with your class. They compare and order fractions. Then they work cooperatively in groups to experiment and problem solve with fractions using a game format. Multiple resources are provided.
Shodor Education Foundation
Algorithm Discovery with Venn Diagrams
Here is a lesson that takes an interesting approach to analyzing data using box and whisker plots. By using an applet that dynamically generates Venn diagrams, the class forms a strategy/algorithm for guessing the rule that fits...
Curated OER
1, 2, 3 o' Clock Rock
Second graders identify the hour and minute hands. They tell time by the hour, nearest quarter hour, half hour, and determine the relationships of time (e.g. minutes in hour, days in a month, weeks in a year). They create over-sized...
Curated OER
Area of Tangram Pieces
Mathematicians calculate the area of a tangram piece without using formulas. They use a geometry journal to record activities during this lesson. They make a set of tangrams and use them to compute area. They use...
Texas Instruments
Vandalism 101
Learners explore logic and use Geometer’s Sketchpad and patterns of logic to solve a puzzle.
American Statistical Association
Scatter It! (Predict Billy’s Height)
How do doctors predict a child's future height? Scholars use one case study to determine the height of a child two years into the future. They graph the given data, determine the line of best fit, and use that to estimate the height in...
Curated OER
Sphere Dressing
Geometric design makes a fashion statement! Challenge learners to design a hat to fit a Styrofoam model. Specifications are clear and pupils use concepts related to three-dimensional objects including volume of irregular shapes and...
American Statistical Association
EllipSeeIt: Visualizing Strength and Direction of Correlation
Seeing is believing. Given several bivariate data sets, learners make scatter plots using the online SeeIt program to visualize the correlation. To get a more complete picture of the topic, they research their own data set and perform an...
Curated OER
World of the Pond
Field trip! The class will review what they know about organisms that dwell in freshwater ponds, then trek down to the old water hole to collect specimens for examination. This includes several web links, useful tips, and an excellent...
Mathematics Assessment Project
Designing a 3d Product in 2d: a Sports Bag
Sew up pupil interest with an engaging, hands-on lesson. Learners first design a sports bag given constraints on the dimensions of fabric. They then evaluate provided sample responses to identify strengths and weaknesses of included...
Mathematics Assessment Project
Sampling and Estimating: Counting Trees
Your task today: count all the trees on a tree farm. To complete the assignment, learners first estimate the number of trees on a tree farm using random sampling. To improve their own response they then evaluate provided...
Mathematics Assessment Project
Solving Problems with Circles and Triangles
After completing a task involving examining the ratio of areas of triangles and circles in a given figure, scholars examine sample responses to identify other strategies they could use to solve the problem.
Mathematics Assessment Project
Evaluating Statements About Enlargements
Double, toil ,and double linear dimensions. Learners first complete an assessment investigating how doubling linear dimensions affects the area of pizzas and the volume of popcorn containers. They then complete an activity investigating...
Curated OER
A Contouring We Go
Students examine the built environment and infrastructures of their community by constructing contour equipment, using the equipment, and comparing their results to current topographical maps of the same area
Curated OER
Rolling Number Sentences
Budding mathematicians investigate how to write number sentences using the Roll-the-Dice tool in "Kid Pix". They correlate the dots on the dice to numbers and then learn to use the addition and equal symbols to write number sentences....
Texas Instruments
Finding Linear Models Part III
Explore linear functions! In this Algebra I instructional activity, mathematicians graph data in a scatter plot and use a graphing calculator to find a linear regression and/or a median-median line. They use the model to make predictions.
