California Education Partners
Theater Field Trip
Here's an assessment task that's better than watching a show. Young mathematicians solve word problems involving multiplication and division with equal groups. They must find the total number of attendees on a trip to a theater based on...
American Statistical Association
How Tall and How Many?
Is there a relationship between height and the number of siblings? Classmates collect data on their heights and numbers of brothers and sisters. They apply statistical methods to determine if such a relationship exists.
American Statistical Association
Scatter It! (Predict Billy’s Height)
How do doctors predict a child's future height? Scholars use one case study to determine the height of a child two years into the future. They graph the given data, determine the line of best fit, and use that to estimate the height in...
Statistics Education Web
It’s Elemental! Sampling from the Periodic Table
How random is random? Demonstrate the different random sampling methods using a hands-on activity. Pupils use various sampling techniques to choose a random sample of elements from the periodic table. They use the different samples to...
Illustrative Mathematics
Chocolate Bar Sales
In this real-world example, algebra learners start to get a sense of how to represent the relationship between two variables in different ways. They start by looking at a partial table of values that define a linear relationship. They...
Illustrative Mathematics
Peaches and Plums
According to the resource graph, which costs more: peaches or plums? Algebra learners compare two proportional relationships and then throw in a banana. Leaving out the scale helps young scholars become intuitive about graphing.
Curated OER
Rolling Twice
Rolling dice is the best way to show your learners how probability comes in to play. Although this lesson does not specify an activity, your mathematicians can try this probability with real dice to calculate their experimental...
Curated OER
Quinoa Pasta 2
Learners discover that a system of linear equations models this mixture of quinoa and corn in a collaborative task. Your learners receive all the relevant information in this second of three variants of tasks that ask them to find...
Education Development Center
Integer Combinations—Postage Stamps Problem (MS Version)
Number patterns can seem mysterious. Help your learners unravel these mysteries as they complete an intriguing task. Through examination, collaborative groups determine that they are able to produce all integers above a certain...
Education Development Center
Choosing Samples
What makes a good sample? Your classes collaborate to answer this question through a task involving areas of rectangles. Given a set of 100 rectangles, they sample a set of five rectangles to estimate the average area of the figures. The...
Education Development Center
Finding Triangle Vertices
Where in the world (or at least in the coordinate plane) is the third vertex? Given two coordinate points for the vertices of a triangle, individuals find the location of the third vertex. They read an account of fictional...
Education Development Center
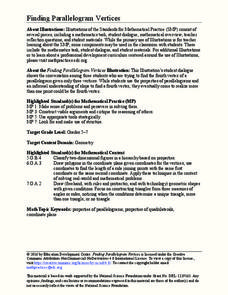
Finding Parallelogram Vertices
Four is the perfect number—if you're talking about parallelograms. Scholars determine a possible fourth vertex of a parallelogram in the coordinate plane given the coordinates of three vertices. They read a conversation...
Howard County Schools
Generous Aunt
Witness the power of exponential growth with an activity that investigates two different savings plans. Class members create tables of values to see how and when a savings plan increasing exponentially exceeds one increasing linearly.
Howard County Schools
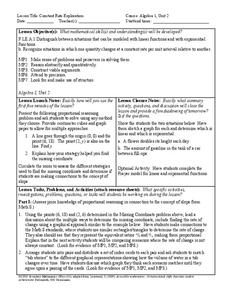
Constant Rate Exploration
Question: What do rectangles and bathtub volume have in common? Answer: Linear equations. Learn how to identify situations that have constant rates by examining two different situations, one proportional and one not proportional.
American Statistical Association
Bubble Trouble!
Which fluids make the best bubbles? Pupils experiment with multiple fluids to determine which allows for the largest bubbles before popping. They gather data, analyze it in multiple ways, and answer analysis questions proving they...
Curated OER
Slope-Intercept Form of a Line
Using the subscriber website Explorelearning.com, young mathematicians observe changes in the slope and y-intercept and their effect on the graph of lines. This activity helps students develop an intuitive sense of the connection between...
Agile Mind
Isabella’s Credit Card
An in-depth activity that involves a real-world problem about credit card debt. Learners are given a scenario in which Isabella plans to stop using her credit card and pay off the balance by paying a fixed amount each month. The first...
Noyce Foundation
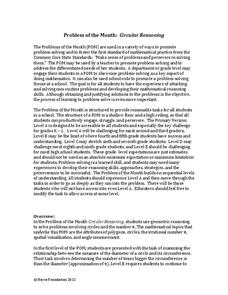
Circular Reasoning
Examine the origin and application of pi in five different levels. The five lessons in the resource begin with an analysis of the relationship between the radius and circumference of a circle. The following lessons lead learners through...
Noyce Foundation
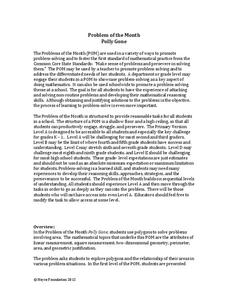
Poly-Gone
Investigate polygons from rectangles to triangles to octagons. Each level of the five-problem series targets a different grade level. Beginning with the level A problem, learners examine the relationship between area and perimeter by...
Noyce Foundation
Part and Whole
Now you'll never have trouble cutting a cake evenly again. Here is a set of five problems all about partitioning shapes into a given number of pieces and identifying the fractional amount of each piece. As learners progress through the...
California Education Partners
Bake Sale
Work with fractional cookies. The three-part assessment task checks the pupils' ability to find the product of fractions and whole numbers, mixed numbers, or fractions. Learners determine the amount of ingredients needed and how many of...
California Education Partners
Lashelles Garden
Let knowledge grow bountifully like plants in a garden. Given a diagram of a rectangular garden split into plots, scholars determine the area of the entire garden and the areas of the individual plots. As a culminating activity, they...
Curated OER
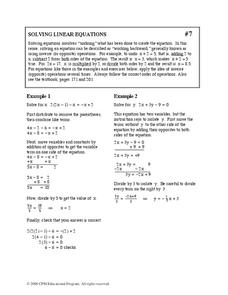
Solving Linear Equations
In this linear equations worksheet, students solve and complete 20 different problems that include using the order of operations. First, they distribute to remove the parentheses and combine like terms. Then, students move variables and...
American Statistical Association
You and Michael
Investigate the relationship between height and arm span. Young statisticians measure the heights and arm spans of each class member and create a scatter plot using the data. They draw a line of best fit and use its slope to explain the...
Other popular searches
- Math Number Sense
- Everyday Math Number Sense
- Math Lessons Number Sense
- Math Counting, Number Sense
- Math Number Sense Activities
- Math Counting Number Sense
- Preschool Five Senses Math
- Math Number Sense Review
- Math Grade Number Sense
- Math Number Concepts
- Math Strategies Number Sense
- Five Senses Math Lesson


