NASA
Data Literacy Cube: Global Atmospheric Temperature Anomaly Data
Evaluate global temperature anomalies using real-world data from NASA! Climatologists analyze a data set using a literacy cube and differentiated question sheets. Team members evaluate global temperature anomaly data with basic...
National Wildlife Federation
The Tide is High, but I’m Holding On… Using ICESat Data to Investigate Sea Level Rise
Based on the rate of melting observed from 2003-2007 in Greenland, it would take less than 10 minutes to fill the Dallas Cowboys' Stadium. The 17th lesson in a series of 21 has scholars use the ICESat data to understand the ice mass...
Georgia Department of Education
Math Class
Young analysts use real (provided) data from a class's test scores to practice using statistical tools. Not only do learners calculate measures of center and spread (including mean, median, deviation, and IQ range), but also use this...
Curated OER
Wind Effects- A Case Study
Students explore hurricanes. In this weather data interpretation lesson, students draw conclusions about the impact of Hurricane Floyd as it related to weather conditions. Students read and interpret a tide data table, a barometric...
Curated OER
Data
Students collect data from an experiment they perform. In this data lesson, students use multiple representations to solve practical problems; describe advantages and disadvantages of the use of each representation. Then, they evaluate...
National Wildlife Federation
Get Your Techno On
Desert regions are hotter for multiple reasons; the lack of vegetation causes the sun's heat to go straight into the surface and the lack of moisture means none of the heat is being transferred into evaporation. This concept, and other...
101 Questions
Breaking a Record
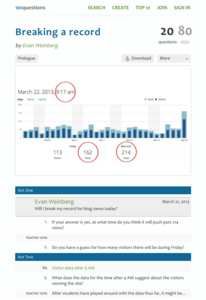
Can we break the record? Groups use provided data detailing the number of visitors to a blog to determine if the number of blog views breaks the previous record. They must take rates into consideration to make their estimates—a great...
Curated OER
Using Vegetation, Precipitation, and Surface Temperature to Study Climate Zones
Using NASA's Live Access Server, earth scientists compare the temperature, precipitation, and normalized difference vegetation index for four different locations. They use the data to identify the climate zone of each location using...
Curated OER
Water Meter Reader
Junior high schoolers learn how to read a water meter, track their family water usage, and discuss the amount in class with other pupils. They will interpret real-world data and graph it. It is ideal for increasing awareness and...
NASA
A Different Perspective
What can we learn from the data? Young scholars analyze actual solar data to answer specific questions. The activity presents an opportunity for an open-ended investigation of the data to conclude a five-part series on solar winds.
Radford University
Modeling Statistical Data
Can people predict the number of future divorces? Scholars research and analyze data on the number of divorces and teenage pregnancies in Virginia over time. They use the data to create graphs, determine the best-fit equations, and make...
Space Awareness
A View From Above
Analyzing and interpreting satellite data takes knowledge and patience. Through a detailed lab investigation, young scholars learn the process of analyzing this data. They use technology to create color images and maps from real...
American Statistical Association
An A-MAZE-ING Comparison
Teach your class how to use descriptive statistics through a hands-on data collection activity. Pupils collect their own data, calculate test statistics, and interpret the results in context. They compare male and female results, looking...
Virginia Department of Education
Exploring Statistics
Collect and analyze data to find out something interesting about classmates. Groups devise a statistical question and collect data from their group members. Individuals then create a display of their data and calculate descriptive...
Curated OER
Assessing and Investigating Population Data
Students examine population projections. In this population data lesson, students research and collect data on the population of the United States. They explore and conclude future population growth patterns. Students construct tables...
Curated OER
Matrix Analysis of Networks
Explore the connection between a finite graph, a directed graph, and a matrix. Graph lines and identify the relationship of matrices in real-world scenarios. Then use this information to work with a partner to plan and design a town...
5280 Math
Interesting Times
Gain a little interest in functions with a real-life task. Young scholars analyze home loan data with a geometric sequence and series. They use the models to make predictions about the total loan payments at certain intervals in a useful...
Statistics Education Web
Text Messaging is Time Consuming! What Gives?
The more you text, the less you study. Have classes test this hypothesis or another question related to text messages. Using real data, learners use technology to create a scatter plot and calculate a regression line. They create a dot...
Howard Hughes Medical Institute
Human Impacts on Biodiversity
Have you always wanted to take your science class on an amazing field trip they will never forget? Now you can! Observe the wildlife in an African savanna through trail cameras with a five-part data analysis activity. Learners analyze...
Curated OER
Histograms
Young statisticians explore the concept of histograms. They construct histograms of various data such as change in a student's pocket, and guessing on a test. hHey analyze data represented as a histogram and a box plot and compare...
Curated OER
Environmental Agents of Mathematics: Mathematics for Change
High schoolers analyze environmental science data using Math. They do research about renewable energy, gather data, create graphs and interpret their findings. Then the group presents their arguments persuasively using their findings to...
Illustrative Mathematics
Data Transfer
A question to ask your class is, How fast is your Internet? That depends on the data transfer rate (DTR), which is the unit rate used in this activity. Math students will calculate how long it takes to download a music file and a video...
Curated OER
Measurement and Data Collecting using Image Processing
Students trace the route of the historical event and measure the distance over which the people involved journeyed. A data sheet be constructed outlining the location of events, and the speed with which the journey occurred.
Statistics Education Web
What Does the Normal Distribution Sound Like?
Groups collect data describing the number of times a bag of microwave popcorn pops at given intervals. Participants discover that the data fits a normal curve and answer questions based on the distribution of this data.


