Illustrative Mathematics
Weather Graph Data
Teaching young mathematicians about collecting and analyzing data allows for a variety of fun and engaging activities. Here, children observe the weather every day for a month, recording their observations in the form of a bar graph....
Howard Hughes Medical Institute
Gorongosa: Scientific Inquiry and Data Analysis
How does the scientific process begin? Introduce ecology scholars to scientific inquiry through an insightful, data-driven lesson. Partners examine data from an ongoing research study to determine the questions it answers. The resource...
Howard Hughes Medical Institute
Lactase Persistence: Evidence for Selection
What's the link between lactase persistence and dairy farming? Biology scholars analyze data to find evidence of the connection, then relate this to human adaptation. Working individually and in small groups, learners view short video...
Teach Engineering
Understanding the Air through Data Analysis
Is there a correlation or causation relationship between air pollutants? Groups develop a hypothesis about the daily variation of air pollutants, specifically ozone and CO2. Using Excel to analyze the data, the groups evaluate their...
Howard Hughes Medical Institute
Got Lactase? Blood Glucose Data Analysis
Many physicals include a blood glucose test, but what are doctors actually testing? Scholars graph and interpret blood glucose data, allowing them to observe the differences in lactase persistence and draw conclusions. They then connect...
Consortium for Ocean Leadership
Nannofossils Reveal Seafloor Spreading Truth
Spread the word about seafloor spreading! Junior geologists prove Albert Wegener right in an activity that combines data analysis and deep ocean exploration. Learners analyze and graph fossil sample data taken from sites along the...
It's About Time
Factors Affecting Population Size
How do we predict future population growth? Young researchers investigate various factors affecting the size of our population. As they calculate and interpret graphs to determine factors that could potentially affect increases...
Howard Hughes Medical Institute
Seed Dispersal in Tropical Forests
How do seeds get around? It's not like plants can control seed dispersal—or can they? Dig deeper into the amazing mechanisms of seed dispersal observed in tropical plants through interactives, a video, and plenty of hands-on data...
Howard Hughes Medical Institute
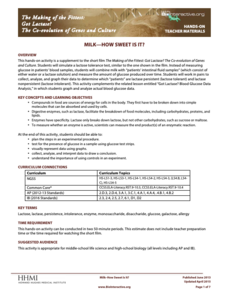
Milk—How Sweet Is It?
Have you ever wondered why some people are lactose intolerant? Participants test simulated patients in a hands-on lab activity to find out! They learn about lactose intolerance by performing an experiment, analyzing data, and drawing...
Howard Hughes Medical Institute
Scientific Inquiry Using WildCam Gorongosa
How do scientists determine what questions to ask to meet their research goals? Help your class develop an inquiry mindset with a lesson based on studies in the Gorongosa National Park. Partners create their own research questions by...
Las Cumbres Observatory
Plotting an Asteroid Light Curve
Data can tell us a lot about celestial objects that are just too far away to study otherwise. Learners examine data on the brightness of an asteroid to predict its rotation rate. Graphing the data reveals a periodic pattern that allows...
US Department of Agriculture
Sink or Float?
Will it sink or will it float? Learners predict the outcome as they drop random objects into a container of water. Then, they keep track of the results and record the data in a t-chart to draw a final conclusion.
Curated OER
Basketball Bounces, Assessment Variation 2
This un-scaffold summative assessment tasks learners to use the height of a bouncing basketball, given the data in graph and table form, to choose the model that is represented. Learners then use the model to answer questions about...
Curated OER
Basketball Bounces, Assessment Variation 1
This highly scaffolded, summative assessment tasks learners to choose the model that represents the height of a bouncing basketball given the data in graph and table form. Learners then use the model to answer questions about the...
Exploratorium
Jacques Cousteau in Seashells
Visionaries create images out of dots to demonstrate the eye-brain connection. Through this activity, they learn that the brain interprets data collected by the eye into recognizable information. Search online for "Jacques Cousteau in...
Curated OER
M&M Science and Math
A series of math and science activities feature M&M's® as manipulatives to help kids work through equations. The resource includes exercises on finding averages, percent of compositions, moles in chemical reactions, genotypes and...
Teach Engineering
Building-Testing-Improving Paper Airplanes: Head's Up!
Take foldables to all new heights. Pupils build and fly different types of paper airplanes in the 14th portion of a 22-part unit on aviation. Groups collect data on distance and flight time for each plane and compare the data from the...
Howard Hughes Medical Institute
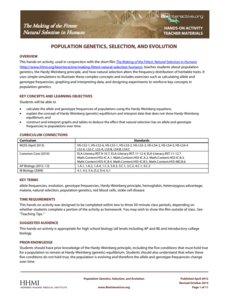
Population Genetics, Selection, and Evolution
The Hardy-Weinberg principle states that alleles and genotypes remain constant in the absence of evolutionary influences. Scholars complete a simple hands-on activity applying the Hardy-Weinberg principle to sample data. They observe how...
University of Pennsylvania
Evolution by Natural Selection
A diagram, data table, and reading passage top this resource. Through it, biology beginners are introduced to the concept of natural selection. They answer some questions and then participate in a simulation using fabric as a habitat and...
US Environmental Protection Agency
Weather and Climate: What's the Difference?
Future weather forecasters collect daily temperatures over a period of time. Afterward, they compare their data with monthly averages, as researched on national weather websites, in order to grasp the difference between weather and...
Teach Engineering
Linear Regression of BMD Scanners
Objects may be more linear than they appear. Scholars investigate the relationship between the number of bone mineral density scanners in the US and time. Once they take the natural logarithm of the number of scanners, a linear...
NOAA
Climate, Weather…What’s the Difference?: Make an Electronic Temperature Sensor
What's the best way to record temperature over a long period of time? Scholars learn about collection of weather and temperature data by building thermistors in the fourth installment of the 10-part Discover Your Changing World series....
Las Cumbres Observatory
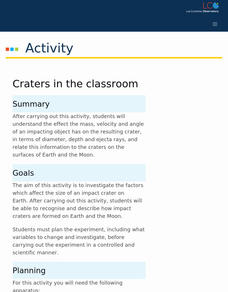
Craters in the Classroom
Laws of motion apply both in space and on Earth. Young experimenters model object impact on the Earth and moon. They use data to determine the effect mass and velocity have on the resulting craters and how that relates to the energy of...
Teach Engineering
Using Hooke's Law to Understand Materials
Provide a Hooke for a lesson on elasticity with an activity that has groups investigate a set of springs. They use a set procedure to collect data to calculate the spring constant for each spring using Hooke's Law. The groups...


