Baylor College
Water: The Math Link
Make a splash with a math skills resource! Starring characters from the children's story Mystery of the Muddled Marsh, several worksheets create interdisciplinary connections between science, language arts, and math. They cover a wide...
Curated OER
Dry Ice: Simply Sublime
A fascinating lesson on states of matter is here for your young scientists. Dry ice is used to challenge learners preconceived notions about how solids work. They discover all sorts of interesting facts about states of matter from...
Curated OER
Let Me Tell You About My State
Fifth graders research one of the 50 U.S. States that they were unfamiliar with. In this U.S. Geography instructional activity, 5th graders utilize encyclopedias as well as the Internet to research a chosen U.S. State in order to write...
Federal Reserve Bank
The Story of the Federal Reserve: Middle School Lesson Plan
After reading the charming cartoon about the United States Federal Reserve, pupils often need to complete activities to retain their learning. The resource does a wonderful job of using class discussion and various written exercises to...
Curated OER
M&M Graphing
Youngsters sort M & M's by color. They graph the M&M's by color on a graph. This classic instructional activity is a wonderful way to introduce the concept and technique of graphing to young mathematicians. Pairs of kids can make...
PLS 3rd Learning
Interpreting Heart Rates During Various Physical Activities
Learners review terminology: pulse, heart rate, target heart rate zone. They work in three groups, and assigned to one of three activity stations. At 5-minute intervals, 4th graders check their pulse and record it on their group card....
Curated OER
Representing Data 1: Using Frequency Graphs
Here is a activity that focuses on the use of frequency graphs to identify a range of measures and makes sense of data in a real-world context as well as constructing frequency graphs given information about the mean, median, and range...
Statistics Education Web
The United States of Obesity
Mississippi has both the highest obesity and poverty rate in the US. Does the rest of the data show a correlation between the poverty and obesity rate in a state? Learners tackle this question as they practice their skills of regression....
Curated OER
Exploring Electricity - Four Activities
These are four classic activities used for instructing upper elementary electricians. The first involves experimenting with the Van de Graaff generator. The second is a series of hands-on experiences with static. In the third activity,...
Teach Engineering
Density Column Lab - Part 1
Mass and density — aren't they the same thing? This activity has groups use balance beams and water displacement to measure several objects. The pupils use the measurements to calculate the density of the objects.
Teach Engineering
Energy Intelligence Agency
Protect the world from energy depletion—join the Energy Intelligence Agency. Using a set of cards, pupils distinguish between correct and incorrect information regarding energy use in the United States. They analyze graphs and diagrams...
SRI International
The Water Crisis
Water, water, everywhere, right? Wrong. Learners assess their own knowledge of water availability on Earth. Then, through a reading, a teacher-led presentation, and an activity, pupils learn about the importance of available clean...
Curated OER
Circle Graph
In this math worksheet, students analyze a circle graph. The circle graph can be used for a variety of math activities and divided into different fractions.
Baylor College
Heart and Lungs
With a partner, youngsters measure their pulse and breathing rates, both at rest and after running in place for a minute. While this activity is not novel, the lesson plan includes a large-scale classroom graphing activity and other...
Curated OER
Learning About A Graphing Calculator
Students investigate the use of a graphing calculator in solving problems. In this algebra lesson, students solve polynomials problems using a calculator.
Curated OER
Great Graphing
Students collect data, use a computer spreadsheet program to create various graphs, and compare the graphs. They state the findings of each graph in writing and decide which graph type best represents the data.
Curated OER
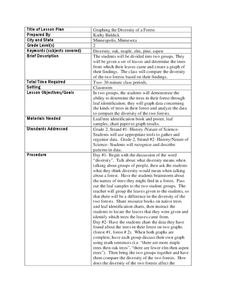
Graphing the Diversity of a Forest
Second graders work in groups to identify what types of trees create which types of leaves In this plant life lesson plan, 2nd graders analyze a set of leaves and identify the tree it came from while graphing the data in a science...
Curated OER
Graphing Dairy Production Statistics
Young scholars discover the total impact of milk on our society by graphing data. In this statistics lesson, students discover the dirty and sometimes unhealthy road milk travels to get into our bodies. Young scholars analyze dairy...
Noyce Foundation
Granny’s Balloon Trip
Take flight with a fun activity focused on graphing data on a coordinate plane. As learners study the data for Granny's hot-air balloon trip, including the time of day and the distance of the balloon from the ground, they practice...
Mathematics Assessment Project
Comparing Lines and Linear Equations
Scholars first complete an assessment task on writing linear equations to model and solve a problem on a running race. They then take part in a card matching activity where they match equations and graphs of lines to diagrams of fluid...
Teach Engineering
Applications of Linear Functions
It's not so straightforward — lines can model a variety of applications. Pupils experience linear relationships within the context of science, including Hooke's and Ohm's Laws. Class members got a taste of motion and speed from the...
Mathematics Vision Project
Module 4: Linear and Exponential Functions
Sequences and series are traditionally thought of as topics for the pre-calculus or calculus class, when learners are figuring out how to develop limits. But this unit uses patterns and slopes of linear functions in unique ways to bring...
Center for Learning in Action
Investigating Physical and Chemical Changes
Super scientists visit ten stations to predict, observe, and draw conclusions about the physical and chemical changes that occur when different states of matter—liquid, solid, and gas—are placed under a variety of conditions. To...
Mathematics Vision Project
Module 5: Rational Functions and Expressions
Where do those asymptotes come from? Learners graph, simplify, and solve rational functions in the fifth module of a 10-part series. Beginning with graphing, pupils determine the key characteristics of the graphs including an in-depth...


